Difficulty: Medium
Requires: Docker, some C&P+modify python code, databases
Cost: £50 upwards.
Objective:
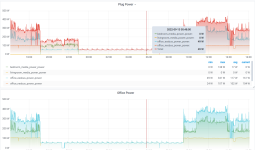
Provide Grafana pretty graphs for power usage in watts over time. This may help aid your saving of electric this fall.
Secondary objective. When strategically placed, these smart monitoring plugs can be used to power down entire rooms/labs/media centres. (Control via HA)
Hardware:
Shelly EM1 - w/ 100Amp coil(s).
 shelly.cloud
LocalBytes Power monitor 13A(!?*) smart plug - or many of them.

 www.mylocalbytes.com
Firmware:
None - Shelly firmware is fine in local MQTT mode. LocalBytes uses Tasmota.
Software:
Docker containers for: Mosquitto, InfluxDB, Grafana and a lightweight Alpine for a python script.
Optional: HomeAssistant install (to control smart plugs)
Optional: Dockercompose
Approach.
1. Install docker on your selected host. A NAS or busy box will do. You can test it out on your windows desktop and move it later.
2. Configure and test InfluxDB docker, being careful to note where your database files live.
3. Configure and test Grafana docker, again being careful where the config DB/files lives.
4. Configure and test the Mosquitto MQTT docker.
5. Setup the hardware, as per the relevant instructions for a local MQTT server. The Shelly and Localbytes both support local MQTT. *
6. Verify you can get the hardware to send you the electrical consumption and usage data over MQTT.#
* You might want to ensure the interval rate for sending data is set to 10 seconds on Tasmota. (It's powered so no battery issues). It's a console command, "poll rate" maybe. Google.
Tying it all together:
1. A small python script which subscribes to the MQTT channel and publishs the data to InfluxDB.
2. Too many hours fiddling and tweaking to make your graphs look just way you like them in Grafana.
Sample Python script: https://gitlab.com/paulcam/home_heating/-/blob/mqtt_conversion/mqtthub/influx_mqtt_bridge.py
Sample Dockercompose: https://gitlab.com/paulcam/home_heating/-/blob/mqtt_conversion/new_docker/docker-compose.yml
Apologies these contain a bunch of other stuff in addition to the basics.
* - Treat ALL power ratings on smart devices as fictional and divide by 2. Don't run more than 6 Amps though it unless you thoroughly check it out inside first.
If there is interest I can edit this and fill out more of the details and provide links to install guides, screenshots etc.
Requires: Docker, some C&P+modify python code, databases
Cost: £50 upwards.
Objective:
Provide Grafana pretty graphs for power usage in watts over time. This may help aid your saving of electric this fall.
Secondary objective. When strategically placed, these smart monitoring plugs can be used to power down entire rooms/labs/media centres. (Control via HA)
Hardware:
Shelly EM1 - w/ 100Amp coil(s).
Shelly EM + 120A Clamp
LocalBytes Power monitor 13A(!?*) smart plug - or many of them.

Tasmota / ESPHome Smart Plug | Power Monitoring | Local Bytes
The Local Bytes Power Monitoring Smart Plug, Preflashed with Tasmota. Reminder: This comes pre-flashed with Tasmota. There will be a few steps to connect the device to your home automation system. Read More! A favourite for getting started with home automation. Automate anything that can be...
Firmware:
None - Shelly firmware is fine in local MQTT mode. LocalBytes uses Tasmota.
Software:
Docker containers for: Mosquitto, InfluxDB, Grafana and a lightweight Alpine for a python script.
Optional: HomeAssistant install (to control smart plugs)
Optional: Dockercompose
Approach.
1. Install docker on your selected host. A NAS or busy box will do. You can test it out on your windows desktop and move it later.
2. Configure and test InfluxDB docker, being careful to note where your database files live.
3. Configure and test Grafana docker, again being careful where the config DB/files lives.
4. Configure and test the Mosquitto MQTT docker.
5. Setup the hardware, as per the relevant instructions for a local MQTT server. The Shelly and Localbytes both support local MQTT. *
6. Verify you can get the hardware to send you the electrical consumption and usage data over MQTT.#
* You might want to ensure the interval rate for sending data is set to 10 seconds on Tasmota. (It's powered so no battery issues). It's a console command, "poll rate" maybe. Google.
Tying it all together:
1. A small python script which subscribes to the MQTT channel and publishs the data to InfluxDB.
2. Too many hours fiddling and tweaking to make your graphs look just way you like them in Grafana.
Sample Python script: https://gitlab.com/paulcam/home_heating/-/blob/mqtt_conversion/mqtthub/influx_mqtt_bridge.py
Sample Dockercompose: https://gitlab.com/paulcam/home_heating/-/blob/mqtt_conversion/new_docker/docker-compose.yml
Apologies these contain a bunch of other stuff in addition to the basics.
* - Treat ALL power ratings on smart devices as fictional and divide by 2. Don't run more than 6 Amps though it unless you thoroughly check it out inside first.
If there is interest I can edit this and fill out more of the details and provide links to install guides, screenshots etc.


