

Is there a means to display the TOPN ONLY Y values on a chart? for instance I have a dataset which shows 7 days worth of data and would like to only show the Y value on the top 5 (peak) instances in the chart.
This produces the following graph:
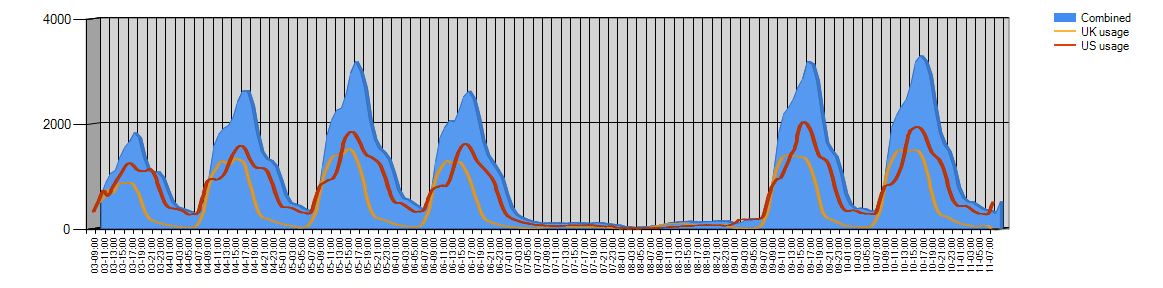
So what I'm after showing is the Y values on those top 5 peaks for a single series (Combined).
Thanks in advance, Paul.
Code:
<asp:Chart ID="Chart4" runat="server" DataSourceID="SqlDataSource1"
        Width="1200px">
        <Series>
            <asp:Series ChartType="Area" Name="Combined" XValueMember="Time"
               YValueMembers="All" Legend="Legend2" ToolTip="(#VALX)-#SERIESNAME(#VALY)">
            </asp:Series>
            <asp:Series ChartType="Spline" Name="UK usage" XValueMember="Time"
                YValueMembers="UK" Legend="Legend2" ToolTip="(#VALX)-#SERIESNAME(#VALY)">
            </asp:Series>
            <asp:Series ChartType="Spline" Name="US usage" XValueMember="Time"
                YValueMembers="US" Legend="Legend2" ToolTip="(#VALX)-#SERIESNAME(#VALY)">
            </asp:Series>
        </Series>
        <ChartAreas>
            <asp:ChartArea Name="ChartArea4">
                <AxisX Interval="2" IsLabelAutoFit="True"
                        LabelAutoFitStyle="LabelsAngleStep45">
                    <LabelStyle Angle="40" Font="Microsoft Sans Serif, 7pt" />
                </AxisX>
                <Area3DStyle Enable3D="True" Inclination="10" WallWidth="1" LightStyle="Realistic" />
            </asp:ChartArea>
        </ChartAreas>
        <Legends>
            <asp:Legend Name="Legend2">
            </asp:Legend>
        </Legends>
</asp:Chart>So what I'm after showing is the Y values on those top 5 peaks for a single series (Combined).
Thanks in advance, Paul.