

Caporegime
- Joined
- 1 Dec 2010
- Posts
- 53,767
- Location
- Welling, London
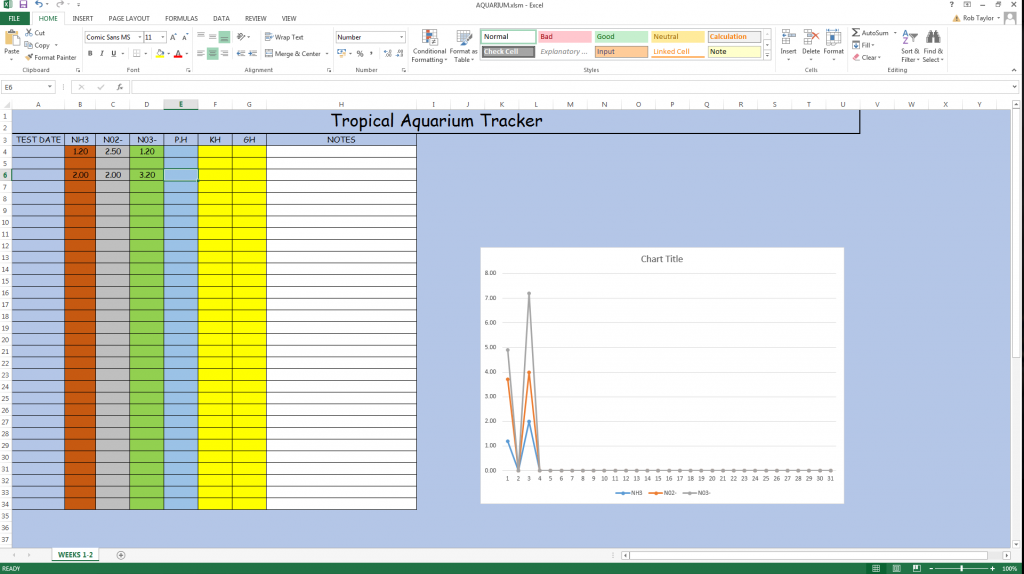
I am trying to do a sheet that has charts in. Each chart has 3 series in with each having data taken from one column. I want this chart to autoupdate over time as you enter new values in.
Problems is it seems to be adding up the rows as you put the numbers in rather than just putting the data straight in the chart. This is leading to much confusion at my end. Hopefully the screenshot shows it more clearly.
I just want each columns data to be represented totally independent of other columns data on a line chart with markers.
Hope you can help. I'm sure it's a beginner's thing. I have looked but I cant find out why I am getting this problem.

")