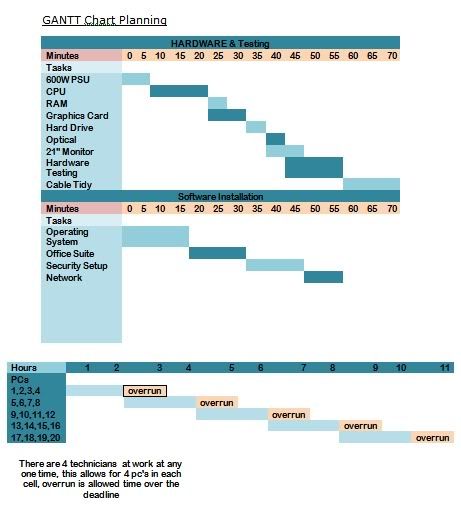
Hi, for my assignment we have to make some gantt charts, now they're simple enough, well up to a certain degree, and I'm using excel, but the thing is, at the moment I have 3 sepeate gantt charts for the following
Computer parts - installation times, the time scaled on the chart is in minutes, 5,10,15,20 etc...
Another chart for software installation, on the same time scale as the above.
Then one for the computer upgrade on a whole, 4 technicians, each building 1 computer at a time, estimated time of building and installing the software is 1 hour 20mins, so I've had to put this into the chart, assuming that is the time for 1 computer and there are 4 techys then around 20 computers can be built in day. This chart is on the scale of hours.
The problem is, my tutor wants a larger gantt chart on a scale of days, and I'm unsure how I am going to fit this into a larger gantt chart on the scale of days?
Any help would be good, thanks.


