

I've been clicking, and searching all the menus for ages now and cant find any tool to help me. Basically I need my graph to show specific Y Axis Values (0, 17.3, 26.2, 34.9, 43.4, 52.2) rather than the automatic generated values (0, 10 , 20, 30, 40, 50, 60)
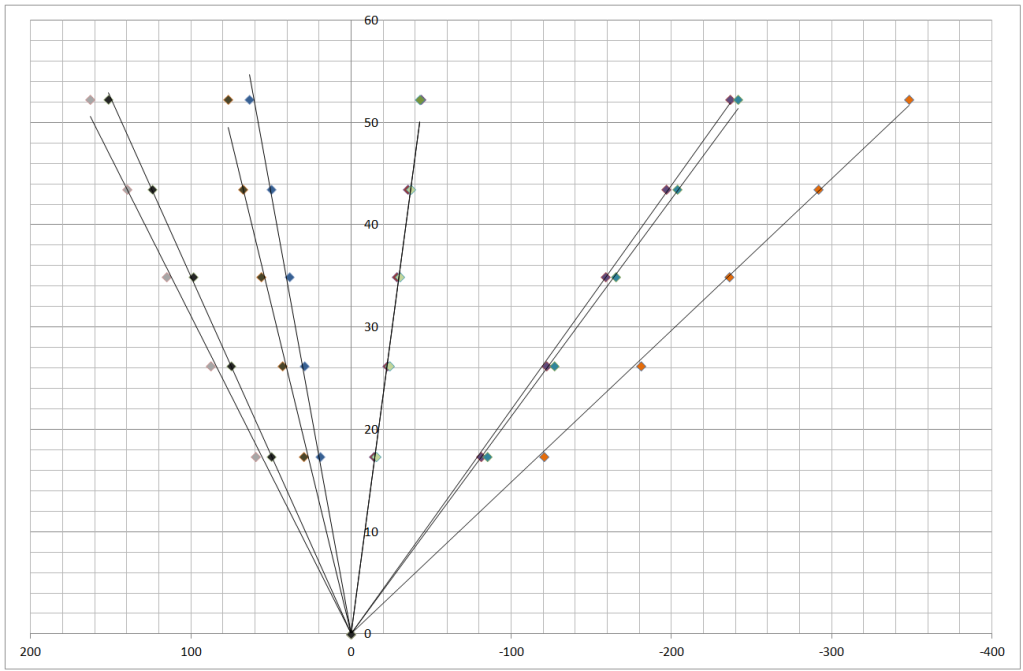
My Graph
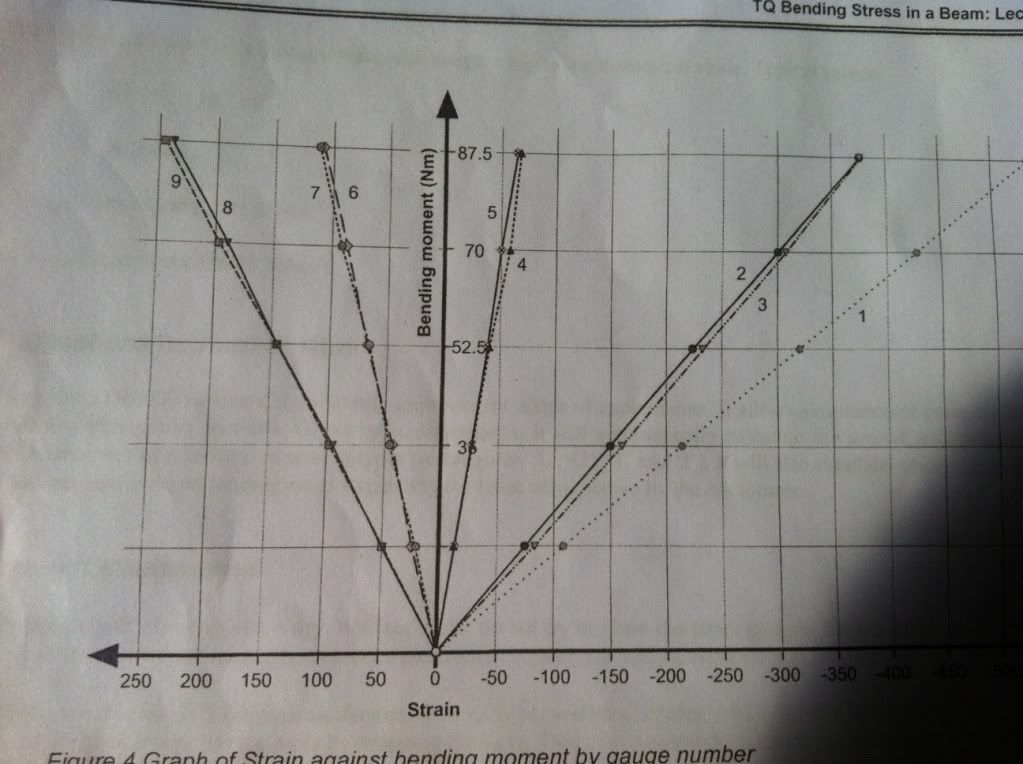
Example Graph (showing specific y values)
My Graph
Example Graph (showing specific y values)
