Spreadsheet help needed

Soldato
Joined
17 Jan 2006
Posts
4,313
I currently work as a print designer and produce numerous publications each year the majority of which are sent out for printing.

My previous boss was fairly vague on figures etc and didn't really care too much about the minutiae of the work, however we have a new boss who is keen to keep a close eye on such things.

As such I want to go back through my records and put together some means of recording each publication, when it goes to print (the work is extremely cyclical so this will simply be one record for each publication), the quantity ordered and the cost.
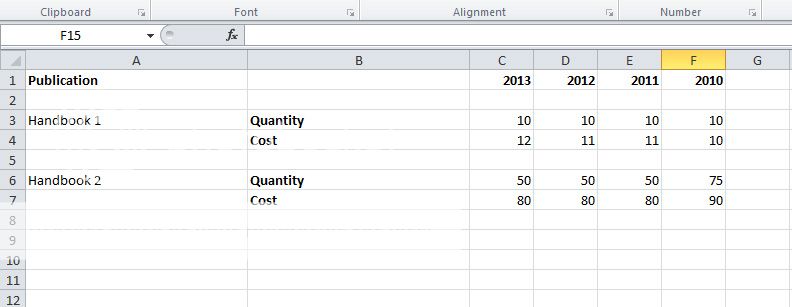
example_zpsb0aaf399.jpg


I was thinking of just putting it all in a spreadsheet (as above) with the publications listed down the left, then having two rows for each publiaction, the top being the quantity and the bottom the cost, then I could record the figures for different years side by side in columns...however I feel this might be a little unwieldy as I have something like 150 publications...

Can anyone suggest a better way of recording this info either a better layout for the spreadsheet or something else that would be simple to setup?

ANy help would be very much appreciated!!!

(ps not sure where best to put a thread like this, feel free to move to most appropraite forum...thanks)
 
That would make it harder to compare the prices year on year for each of the publications.

Also, I want to be able to record publications that used to be printed and no longer are which might get lost if I had a separate sheet per year...
 
Create several worksheets at the bottom totalling all the years you want to include and then add the publications which were printed for those years as said above. Another worksheet can be made to compare each of the years total costs and prints?
 
If you had 4 columns; year, publication, cost, quantity, you could pivot the data for year on year comparisons for a selected publication(s).
 
Create several worksheets at the bottom totalling all the years you want to include and then add the publications which were printed for those years as said above. Another worksheet can be made to compare each of the years total costs and prints?

I see what you are saying but it's not the total costs I want to compare, it will be the costs of each individual publication...

Pivot table?

A what??? Might you explain what one might be?


Excel is not one of my main strengths, I can put together most things I need but they tend to be pretty simple. This is rather more complex than I'm used to!!
 
As much as I don't really like it, this is probably the easiest way for something like what you're trying to do:

Publication; 2013-Cost; 2013-Quantity; 2012-Cost; 2012-Quantity;
Handbook 1;
Handbook 2;
 
I was wondering about something like that but would have liked the cost info numbers next to each other, and the same for the quantities to make it easy to compare at a glance...
 
1 sheet with 4 columns (publication, year, qty and cost) and all of your data, then whatever other sheets you want that reference this data and report on it using whatever layouts meet your needs.
 
A what??? Might you explain what one might be?

Arrange the data in columns; publication name, year, quantity, cost. Then fill in all the historic data you have - you can speed this up by copy/pasting things like name & year.

Make sure you don't have an empty line between your column titles and the data. Select any cell in the data table, go to Insert > Pivot table, click OK. On the right hand side of the pivot table in the Pivot Table Field List; move Publication into Report Filter, Year into Row Labels and Cost & Quantity into Values.

You can then select the publication you want to see using the filter in cell A2.

You can insert a Pivot chart as well which will draw pretty pictures with whatever data you select.
 
I was suggesting that you do the following:

table1_zps4787e946.png


But it would be better, in my opinion, if you do this:

Table2_zpsba9938f8.png


You can do subcategories in these tables, but I'm not sure how. Anyway, sort your data in that way, then select the table and press ctrl+t to make a table. You can then sort your data by any of the heading parameters.
 
Odd, I thought I replied to this thread yesterday saying thanks for all the help but it seems it didn't post.

Anyway, I finally got a chance to playa around with some sample data and have to say setting it all out in columns and then using pivot tables and graphs works very nicely so thanks for the suggestions.

I have a further suplimentary question...

Having seen what can be done with the pivot tables, I have decided that I would like to add another column to the data to assign each of the publications to a (for want of a better word) 'class' ie marketing, fundraising, etc etc.

I have seen that it is nice and simple to do this and add the 'class' as an additional filter in the pivot table so I can look at all publications belonging to a class.

However, what I would like to be able to do would be to create a pie chart from the data, which would show a break down of the spending by class in each year.

Ideally with labels of the total cost for the class and the percentage of the total cost. However I can't get my brain around how I would go about doing this ie what fields should be filters, rows etc - or if it's even possible with the information in my data set...

Might anyone be kind enough to give me a hand to set this up?


Edit: Nevermind, just had a brainwave after I posted this and I now have it working as I wanted...these pivot tables and caharts are great!!! :)
 
Last edited:
Having finally had a bit time to come back to this, I'm after a little more help with this please.

I've pretty much set up my spreadsheet for data, with columns:

Publication | Year | Month | Academic Year | Cost | Quantity | Class | Printer

And I've set up a few pivot tables to allow different methods of sorting/reporting info.

1) Filter by publication and display cost and quantity for each year

2) Filter by Printer and/or Class and display publications in rows with cost and quantity for years in columns

3) Filter by Year amd display publications, cost and quantity.


These seem to be working ok but I have come across a strange problem...

I edited some of my data as I had originally named one set of publications as the same name (Term Diary) however for ease of reporting etc I have now changed the names so there are three variations (Autumn, Spring. Summer).

This is working fine foe table 1 and table 3 but for some reason these entries no longer show up in table 2?

As a test I also changed the name of the printer and that has appeared in the list for filtering on table 2 but when selected nothing is shown in the table?

I've ensured update data is selected in the pivot table options etc but it's still not showing....anyone got any thoughts?

Thanks in advance for any help.
 
My guess would be the column heading for publications where you can click this and see any filter is in place on this to only include specific publications rather than the option which I think is at the top to include all values in the publications column.

My second guess would be in the pivot table (table 2) isn't referencing all of rows and columns on the sheet where the data is held.

Third guess, is there a red explanation mark on the menu bar somewhere to refresh data, might not exist when referencing another sheet though, i'm working from memory as I don't have Excel installed at the moment.
 
Back
Top Bottom