Windows 10 memory leak

Associate
Joined
2 Aug 2004
Posts
929
so lately im getting some sort of memory leak in windows. the trouble is i dont know where, it doesnt show up in the task manager what it is consuming all the ram but certainly shows in the task managers performance as something eating tons of ram.

its getting rather anoying as i keep getting annoying popups with windows moaning about lack of ram. ifi had 4GB fair enough but i have 16GB.

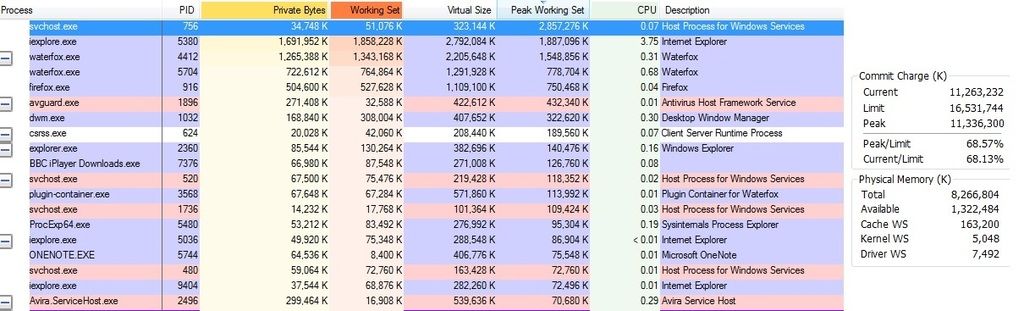
is there anything i should be doing to try and pin down just what the hell is eating all the ram and what i might be able to do about it?
 
The thing to do is to close all your open programs while monitoring the RAM usage, one by one and from task manager. This should indicate which application is eating all your available memory.
 
The thing to do is to close all your open programs while monitoring the RAM usage, one by one and from task manager. This should indicate which application is eating all your available memory.

closing everything results in 10GB being used. of which i can account for almost none of it. im surethere is a leak going on but its not indecated anywhere obvious that i can see, which is why am at somewhat of a loss
 
Have you got any overclocking to the RAM?

nope actualy its running far under spec, its ddr3 2400 but with 4 sticks it was being arsey about running at that speed so i ended up sticking it to 1600 because lazyness.


I only realised recently you can order the list in task manager by order of hungriness by clicking the list header. Very handy.

indeed you can but sadly whats shown as in use doesnt come close to explaining whats eating all the rom
 
I think you can expand that to windows 7 .. microsoft garbage collection is garbage (you beat me to creating a thread)

I prefer to leave computer in standby at the end of the day for fast startup and quick restore of the work and browsing sessions I was previously using.
But after about 5 days the commit charge on the computer is reaching about its 32GB limit (4 x the meager 8GB RAM I have, anyway to increase that ?) and I have warnings about low memory and that I should stop some applications, computer seems slow to context switch , at which point I typically save work and reboot.

most folks reboot frequently.

Monitoring the situation with process explorer I can see how the resources (Virtual size which contributes to commit) demanded by some processes build up, potentially due to poor garbage collection and memory management in those tools.

I see explorer.exe grow by by about 3x to 1gb over 5 days.
you can periodically dump a csv/xl file from process monitor to track what is happening.
I see this with personal computer and works computer (which has potentially better managed updates)

I hope i have not subverted your thread too much, collecting data with process monitor should help get a handle on this.
 
Have you looked at Peak Working Set in Task Manager?

erm no as im not sure what you mean. ive looked at ram usage as shown in the task manager both the running processes page and the "details" page none of which shows anything consuming vast amounts of ram.

What do you usually run?

erm quite a lot of stuff but a clean boot it runs at bout 4gb ram usage and firefox can regularly add 1 ta 1.5GB on top of that. the issue is there 6 to 8 GB somitemes more being sown as used but i can see nothing that is using it

I think you can expand that to windows 7 .. microsoft garbage collection is garbage (you beat me to creating a thread)

I prefer to leave computer in standby at the end of the day for fast startup and quick restore of the work and browsing sessions I was previously using.
But after about 5 days the commit charge on the computer is reaching about its 32GB limit (4 x the meager 8GB RAM I have, anyway to increase that ?) and I have warnings about low memory and that I should stop some applications, computer seems slow to context switch , at which point I typically save work and reboot.

most folks reboot frequently.

Monitoring the situation with process explorer I can see how the resources (Virtual size which contributes to commit) demanded by some processes build up, potentially due to poor garbage collection and memory management in those tools.

I see explorer.exe grow by by about 3x to 1gb over 5 days.
you can periodically dump a csv/xl file from process monitor to track what is happening.
I see this with personal computer and works computer (which has potentially better managed updates)

I hope i have not subverted your thread too much, collecting data with process monitor should help get a handle on this.

it gets rebooted fresh every morning, so its not getting left on for any more than maybe 12 hours, however when it doen the ram eating i have to reboot to claim it all back.

I would try a clean install. Back up and do and windows refresh. Don't install any bloat, just do drivers and maybe a few choice games and see how it goes.

erm no. no longer am a 18 and think its fun to wipe and fresh boot every 6 months.
 
.. adding a snapshot of type of information available with process explorer

proc_zpsjoc79jji.jpg~original


I too am trying to nail down the culprits.
I have many tabs open in the browsers so these are legit values, but I think
avira(anti virus) / explorer / svchost|756(windows update) are all ott.
 
mark2410, maybe you can do analysis with task manager, but MS process explorer
like my capture above will show current working size and peak(historical), so should show
culprit, for MS low memory popups.
... I know the process names (but now need to decide if i find alternatives) .. you do not know process names yet.
[ I agree fresh boot is out .. effort of archiving all personal data and tool
configs is a nightmare .. and do not know how folks tolerate/manage this ]

ill certainly that, ive now got process explorer so hopefully that will tell me where the hell its going, thanks

Check in task manager what your Non-Paged pool memory usage is. If this is high you may have a driver causing the leak.

You can identify which driver is consuming memory through using this guide and PoolMon:

https://blogs.msdn.microsoft.com/ntdebugging/2012/08/30/troubleshooting-pool-leaks-part-2-poolmon/

I've used this technique in the past and in my case it was a USB 3.0 Ethernet Adapter causing the memory leak.

thanks i shall, now just need to wait till the memory gets mystery eaten
 
Back
Top Bottom