

You are using an out of date browser. It may not display this or other websites correctly.
You should upgrade or use an alternative browser.
You should upgrade or use an alternative browser.
House prices..
- Thread starter fendi
- Start date
More options
Thread starter's postsSoldato
- Joined
- 3 Jun 2005
- Posts
- 5,365
- Location
- West Sussex
Weak demand
December marked the fifth consecutive month of falling prices, according to the Rics survey.
The housing market is clearly feeling the pinch from the credit crunch
Ian Perry, Royal Institution of Chartered Surveyors
Demand for property remains weak, with 25% more surveyors reporting a fall in the number of people looking to buy a new house than recording an increase, it said.
The survey also showed that surveyor confidence about the outlook for sales and prices had deteriorated, with both measures at their lowest level since the questions were first included in the survey in 1998.
"The housing market is clearly feeling the pinch from the credit crunch and the round of interest rate hikes in 2007," said Rics spokesman Ian Perry.
However, he said that while sentiment had fallen sharply to a "low ebb", the underlying economic conditions are "vastly different" to those in place during the 1990s housing recession.
"Supply would have to loosen considerably before prices experience a significant dip," he added.
The demand isn't weak it is just that few can actually afford them. The days of borrowing 8-9 times your salary are all over with. Many mortgage lenders will now only give you 70% of morgage on new builds and properties under 1 year old. They must be expecting a dip.
What do you mean? The RICS report surveys the whole country, in the early in 90's both national average nominal and real prices fell. Surely in more places than not prices did fall in the 90's? Why do you say that in most places prices didn't fall?In most areas prices didn't fall in the 90's though
Rotty, I just plotted this chart from the Nationwide data here:
http://www.nationwide.co.uk/hpi/historical.htm

This is nominal, not real, and even this show virtually all areas experienced falls in the 90’s. Northern Ireland seems to be an exception. So how can you say “In most areas prices didn't fall in the 90's though”?
http://www.nationwide.co.uk/hpi/historical.htm
This is nominal, not real, and even this show virtually all areas experienced falls in the 90’s. Northern Ireland seems to be an exception. So how can you say “In most areas prices didn't fall in the 90's though”?
Soldato
- Joined
- 3 Jun 2005
- Posts
- 5,365
- Location
- West Sussex
Returns in the UK property market plunged another 3.7pc in December, the largest monthly fall for the Investment Property Databank since records began in 1986.
Not looking much better in this article.
http://www.telegraph.co.uk/money/ma...GAVCBQYIV0?xml=/money/2008/01/16/cnprop16.xml
QUOTE]
I posted the national average chart earlier in this thread ( too much to go back and look through ) and prices were roughly flat through the 90s
/edit here is a national average chart , through the 90s it looks pretty flat

even on your chart any dip is minor through the 90s in most areas
QUOTE]
I posted the national average chart earlier in this thread ( too much to go back and look through ) and prices were roughly flat through the 90s
/edit here is a national average chart , through the 90s it looks pretty flat
even on your chart any dip is minor through the 90s in most areas
If we're going to be pedantic you said 'In most areas prices didn't fall in the 90's though' and then backed that up with a national average chart.
This doesn't show anything, it could be that most areas did fall but this was counteracted by some areas rising significantly.
This is the trouble with looking at average figures, you lose some of the detail.
possibly but it is often painted as this huge diaster that happened when for those of us around at the time it was no big deal outside of London
Soldato
- Joined
- 3 Jun 2005
- Posts
- 5,365
- Location
- West Sussex
possibly but it is often painted as this huge diaster that happened when for those of us around at the time it was no big deal outside of London
Sorry that is complete bull.
My sister bought a flat in Bookham, Surrey in 1989 for 65k. In the height of the 90's crash it was worth less than 35k.
Try telling her and the following ten years of negative equity she suffered it wasn't a big deal!!
Rotty, you're wrong to say that most areas prices didn't fall in the 90's.
Here's the Nationwide data again with the UK average added:
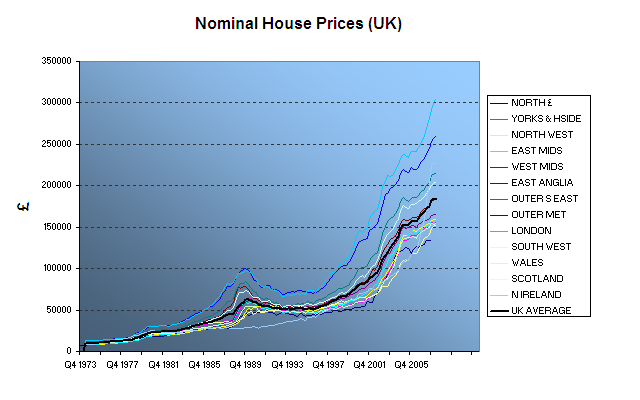
I've looked at the data and every area they detail fell during the 90's except Northern Ireland and Scotland. Scotland however was dead flat between 1992 and 1997 though so fell in real terms.
The correct statement is all areas except Scotland and Northern Ireland experienced nominal falls during the 90's and all areas except Northern Ireland experienced significant falls in real terms - after considering inflation over the period. "Real terms" is the only sensible way to look at house prices.
Here's the UK house price index considering RPI, I drew it from Nationwide data linked to above:
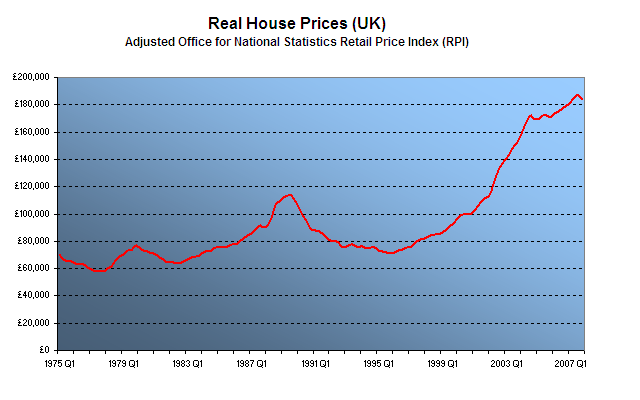
Considering the average real value fell by some 37% I think your statement of "most areas prices didn't fall in the 90's" is frankly ridiculous.
Here's the Nationwide data again with the UK average added:
I've looked at the data and every area they detail fell during the 90's except Northern Ireland and Scotland. Scotland however was dead flat between 1992 and 1997 though so fell in real terms.
The correct statement is all areas except Scotland and Northern Ireland experienced nominal falls during the 90's and all areas except Northern Ireland experienced significant falls in real terms - after considering inflation over the period. "Real terms" is the only sensible way to look at house prices.
Here's the UK house price index considering RPI, I drew it from Nationwide data linked to above:
Considering the average real value fell by some 37% I think your statement of "most areas prices didn't fall in the 90's" is frankly ridiculous.
Rotty, you're wrong to say that most areas prices didn't fall in the 90's.
Here's the Nationwide data again with the UK average added:
I've looked at the data and every area they detail fell during the 90's except Northern Ireland and Scotland. Scotland however was dead flat between 1992 and 1997 though so fell in real terms.
The correct statement is all areas except Scotland and Northern Ireland experienced nominal falls during the 90's and all areas except Northern Ireland experienced significant falls in real terms - after considering inflation over the period. "Real terms" is the only sensible way to look at house prices.
Here's the UK house price index considering RPI, I drew it from Nationwide data linked to above:
Considering the average real value fell by some 37% I think your statement of "most areas prices didn't fall in the 90's" is frankly ridiculous.
Ahhh, the 'real terms' dodge again... Notice it's never applied when working out price rises. Your first graph does actually support Rotty's point by the way, the majority of areas did not see significant drops, just a lack of rises with a slight drop.
Isn't it? I always "apply" it to my thinking... about everything. 'Real terms' is the only way to think about money over time.Ahhh, the 'real terms' dodge again... Notice it's never applied when working out price rises.
Rubbish! He said most places didn't fall - I show that most placed did fall. How doesn't that support his position? The word "significant" wasn't mentioned by Rotty’s initial comment. Anyway - my chart show nominal falls of 20.1% (£62,782 to £50,128), subjectively I'd say that was significant. What was the average salary in the early nineties? However, if we're talking about significance, then we have to talk about real terms, down 37%.Your first graph does actually support Rotty's point by the way, the majority of areas did not see significant drops, just a lack of rises with a slight drop.
Last edited:
Isn't it? I always "apply" it to my thinking... about everything. 'Real terms' is the only way to think about money over time.
It very rarely is when talking about house price rises, only ever when people want to make falls look bigger.
Without the manipulation, Rotty's argument is correct. House prices did not fall significantly during the last 'crash' in most areas, or indeed by the average. The simply stagnated. There were a few areas that experienced much higher inflation rates before the crash, and a corresponding much higher drop, but that wasn't the experience of most people.
Without the manipulation, Rotty's argument is correct.
 Can you please which bit? He said prices didn't fall in most areas when they clearly did, both in real terms as well as nominally. What's the problem here?
Soldato
- Joined
- 3 Jun 2005
- Posts
- 5,365
- Location
- West Sussex
It's like saying if we ignore all the areas where prices fell, we can say prices actually didn't fall at all.
")
The problem would appear to be that I don't share your faith in what's going to happen to the housing market, nor your interpretation of what happened in the past.
The problem would appear to be that I don't share your faith in what's going to happen to the housing market, nor your interpretation of what happened in the past.
Our respective faiths in the future are irrelevant for this point. Let's stick to the case in hand.
Rotty said prices didn't fall in most areas during the 90's and you agreed with him. You're both wrong in my opinion.
Can you (or Rotty) explain your interpretation to me?
Our respective faiths in the future are irrelevant for this point. Let's stick to the case in hand.
Rotty said prices didn't fall in most areas during the 90's and you agreed with him. You're both wrong in my opinion.
Can you (or Rotty) explain your interpretation to me?
I already have, in the majority of areas (based on the information provided by you) there were not significant falls in prices. There were large falls in a few areas that had previously high inflation levels, but these were not the majority.
It does, of course, depend on your definition of significant, however.
The word "significant" wasn't in Rotty's statement, hence it and your agreement is simply wrong.
Sorry, forgot you're literal when it suits you.