

Associate
- Joined
- 22 Dec 2010
- Posts
- 770
- Location
- West Midlands
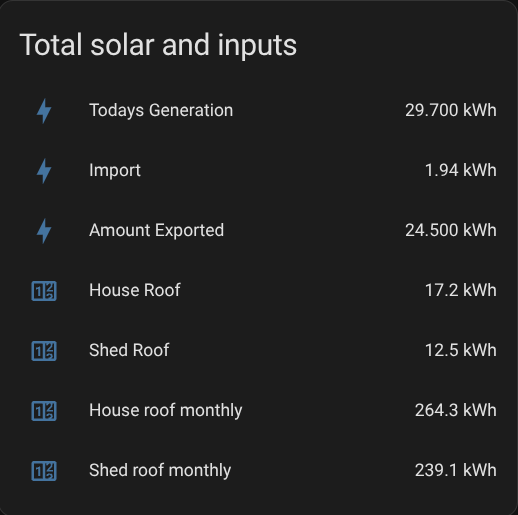
24.56 kWh miserable day 

Nope, I beat you yesterday, I should have printed it and framed it@Ron-ski best of 3?
You do seem to beat me in the morning quite often. Today is another crap day for me, I'm #3!!Nope, I beat you yesterday, I should have printed it and framed it
You didn't stay there for long, your now back at number one. I'm sure there will be plenty of days over winter where I'll beat you.You do seem to beat me in the morning quite often. Today is another crap day for me, I'm #3!!
there may be some days that i win too lolYou didn't stay there for long, your now back at number one. I'm sure there will be plenty of days over winter where I'll beat you.
