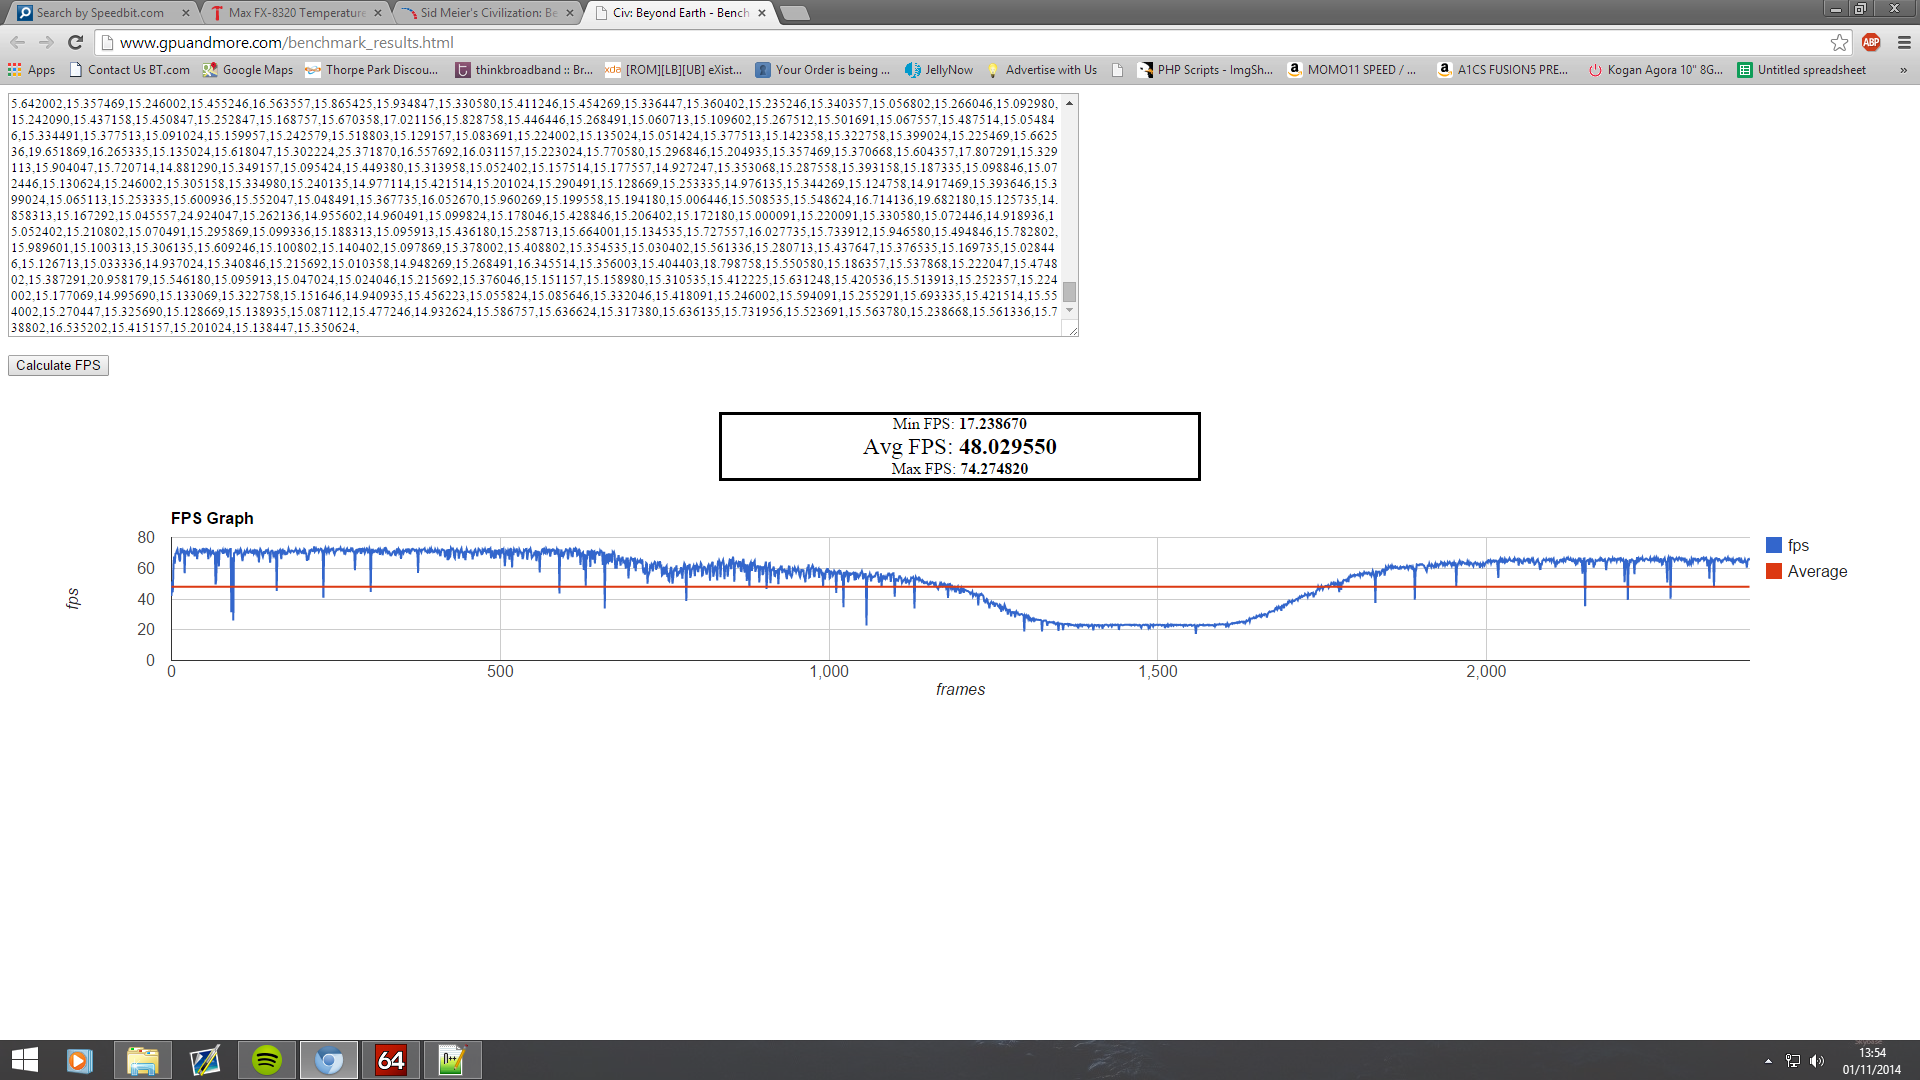
I realise most people have probably run this now, but I thought I'd let people know of a little update.
I've made a few changes to the webpage for calculating the fps and doing the graph. It still does that but now it also produces a frametime graph a bit like the FRAPS one that Vortez show at the bottom of
this page.
The new section will identify the max frametime and the min frametime as well as display the value of the 99th Percentile. This means that 99% of the frames were better than this value. So if you ignore a few extreme high frametimes (such as at the start of Kaap's latest run where there's a low FPS dip near the start) you should mostly not see dips below that.
My understanding is that you want the line on the graph to be as low as possible and as flat as possible. Lower means higher FPS and flatter means more consistent.
To compare it to the FRAPS graph, I believe the 99th percentile is what they call the 1%. I've not shown the 0.1% value and I believe the average will probably be the frametime used to calculate the average fps that is displayed in the original graph.
I realise it won't affect any of the results and probably isn't a lot of use for a benchmark thread, but thought people might find it interesting.
Greg has kindly uploaded it and replaced the
existing page, so no links need to change. Other than adding the new info in it hasn't changed, so it doesn't invalidate any results.
For anyone interested I used the following page for my understanding of how to calculate it:
http://www.dummies.com/how-to/content/how-to-calculate-percentiles-in-statistics.html
I believe Excel may have a built-in function for calculating percentiles. I've not got Excel so haven't tried it, hopefully the results would come out the same!


