

Soldato
- Joined
- 5 Jul 2007
- Posts
- 5,511
- Location
- London
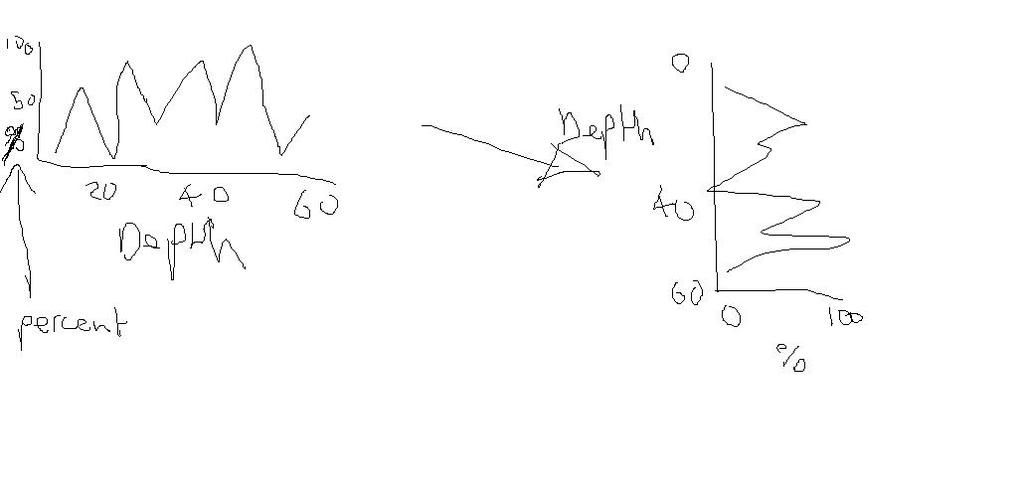
So i'm trying to do some coursework, which involves plotting the finding of an earth core sample. So i'm able to draw graphs, but really i need the depth going down the y axis, starting with 0 at the top, and ending at the deepest depth. And the the x axis to have the percentage of findings at the certain depths. I've drawn a basic diagram of what I want but i'm not sure how to get there. Using office 2007.
Thanks very much for any help, tom.
Thanks very much for any help, tom.