Right being a Scout leader means I like to include as many Scouts in a camp as possible trying to arrange dates around their own family holidays etc. So everytime a camp comes up I ask for the dates they are available to get a just of who is available when.
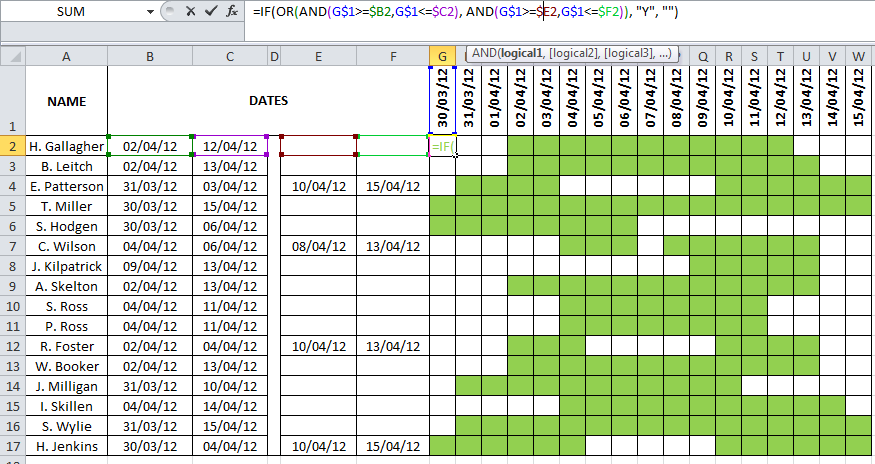
Now I thought of trying to show this in an excel sheet to see the best overlap. I ask you if there is an easier way of doing this, I have just written the dates in manually then filled in the corresponding cells.
But with the use of additional conditional formatting/graphs or other features can I make this job easier, where I can fill in dates and the cells with highlight themselves?
Any input is greatly appreciated")
Now I thought of trying to show this in an excel sheet to see the best overlap. I ask you if there is an easier way of doing this, I have just written the dates in manually then filled in the corresponding cells.
But with the use of additional conditional formatting/graphs or other features can I make this job easier, where I can fill in dates and the cells with highlight themselves?
Any input is greatly appreciated
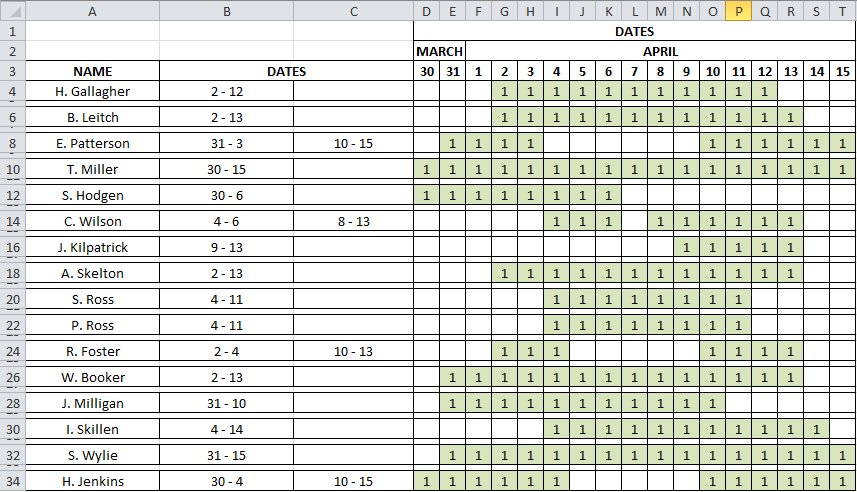
 Thanks very much, should make it easier to visualise dates now when planning camps etc