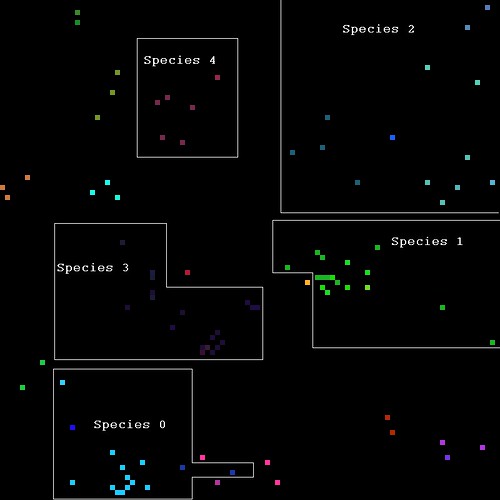
Probably best to start off with an example:
The above is an image representation of my results. The project is a genetic algorithm evolving temporal properties of a neruobiologically sound neural circuit of the female cricket's auditory system for performing phonotaxis (sound localisaion and pattern recognition of the male cricket calling song). While coevolving the male cricket calling song paramters, all in a 2d spatial representation. You don't really need to understand any of this to help me luckily!
In laymans terms, I have a model of female crickets and of male crickets and I am studying the evolution of the model paramters. In the end I end up with a population that is divided spatially as well as on the genetic properties. That is what you can see in the above image. You can clearly see a grouping of pixels with similar colours. The colour of the pixels corresponds to the male calling song paramters in a 1:1 mapping onto the Red, Green and Blue values of the pixels. (these properites are things like syllable period, inter-chirp period, number of syllables per chirp, and basicly just define the pattern of the song). Therefore the data is easily rendered as a 2d, 3 colour image which provides easy visualisation. (Look at the females genes, there are over 27 variables and plotting 27 dimensions is not easy).
I need to be able to show that those visible groups do not belong to the same population, and that the differences in calling song parameters between the groups is significant. This is not easy to do autonomously as there is no actual specified grouping. To combat this I made a simple program which allows you to mannually selected the pixels that belong to the same group:
Here is a typical output in graphical form
I end up with a set of data points in each group, and then calculate max/min/range/mean/variance/std deviation/std error on botht the X and Y variables as well as for each of the the calling song parameters.
e.g:
Group Number 0
[N Size] = 17
Max X = 46.0 Min X = 12.0
Max Y = 100.0 Min Y = 76.0
X Range = 34.0 Y Range = 24.0
Mean X = 23.470588235294116 Mean Y = 88.17647058823529
Variance X = 79.02157541217179 Variance Y = 60.90474251984535
STD. Dev. X = 8.889408046218364 STD. Dev. Y = 7.804149058023261
STD. Err. X = 2.1559981366925784 STD. Err. Y = 1.8927841696643808
J = 0
Max J = 2.0 Min J = 1.0
J Range = 1.0
Mean J = 1.0
Variance J = 0.058823529411764705
STD. Dev. J = 0.24253562503633297
STD. Err. J = 0.058823529411764705
J = 1
Max J = 15.0 Min J = 1.0
J Range = 14.0
Mean J = 12.0
Variance J = 21.529411764705884
STD. Dev. J = 4.6399797159800045
STD. Err. J = 1.1253603805711172
J = 2
Max J = 20.0 Min J = 12.0
J Range = 8.0
Mean J = 17.352941176470587
Variance J = 6.044575615713417
STD. Dev. J = 2.4585718650699264
STD. Err. J = 0.5962912639914775
But now I need to do some statistical testing but my brain, and books, are failing me. I need some kind of complex multivariate statistical method to be able to do this. The problem is that the basic ANOVA is only 1 dimensional with respect to the dependent variable.
The problem can be divided into 2 parts, firstly show that the groups reside in different locations and then showing that the genetic properties are different. But it may make more sense just to assume the data is 5 dimensional.
Any ideas? Any one done anything similar? Must be a fairly common problem, especially in somehting like ecology.