• Competitor rules

    Please remember that any mention of competitors, hinting at competitors or offering to provide details of competitors will result in an account suspension. The full rules can be found under the 'Terms and Rules' link in the bottom right corner of your screen. Just don't mention competitors in any way, shape or form and you'll be OK.

**Official 3DMark API Overhead Leaderboard**

Caporegime
Joined
17 Mar 2012
Posts
49,564
Location
ARC-L1, Stanton System
This is the first application to test CPU performance with some of the new low level Graphics API's.
To explain what that means i couldn't do it better than Future Mark themselves.

So here it is:

Games make thousands of draw calls per frame, but each one creates performance-limiting overhead for the CPU. APIs with less overhead can handle more draw calls and produce richer visuals. The 3DMark API Overhead feature test is the world's first independent test for comparing the performance of DirectX 12, Mantle, and DirectX 11. See how many draw calls your PC can handle with each API before the frame rate drops below 30 fps.
In this leaderboard we will be competing for CPU Drawcalls in Mantle and DirectX 12 separately. (The how fast the GPU is is not relevant to the performance in this.)

For DirectX 12 you will need windows 10.
For Mantle you can run in Windows 7,8,8.1 and 10 but you will need an AMD GCN architecture GPU.
Please note that the performance of Mantle is different in each OS so results will be categorised by OS as well as by API.

Its available here: 3DMark

Unfortunately it is not free. (at this point)

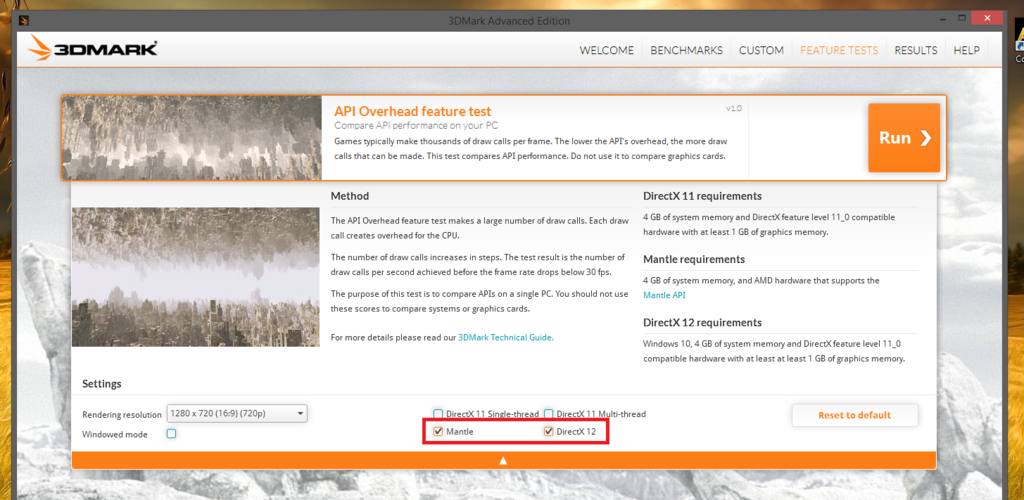
Instructions: use these settings, Only 720P will be added, it gets too cluttered with all resolutions posted.


Last edited:
Win10 - DX12 - 720P

Score: 22,198,217. 4790k @4.8Ghz - 290 @ 1170/1600. MadMatty: Link
Score: 22,018,815. 3770K @4.4Ghz - 290 @ 1100/1400. win8.1: Link
Score: 19,802,318. 4770K @4.7Ghz - 980Ti 1530/4000. Robzere31: Link
Score: 18,856,159. 4770K @4.5Ghz - 980TI @ 1482/7400. Robzere31: Link
Score: 18,566,111. 5960x @4Ghz - Fury_X @ Stock. AMDMatt: Link
Score: 18,368,315. 5820K @4.6Ghz - Fury X @ ?????. uksoldierboy: Link
Score: 18,033,519. 4690K @ 4.7Ghz - 970 @ 1550/1953. Humbug Link
Score: 16,843,506. 5820k @stock - 980 @ 1329/1753. MasterOC: Link
Score: 15,937,380. FX-9590 @ 4.7Ghz - 970 @ 1450/1828. Humbug Link
Score: 15,336,505. 4790k @stock - Fur-X @stock. savagesam117: Link
Score: 14,970,812. FX-9590 @ 4.7Ghz - 290 @ 1040/1350. Humbug: Link
Score: 13,492,278. 2700K @ 4.7Ghz - 780TI @ 1202/1853. PieEater: Link
Score: 4,197,881. FX-8350 @ 4.8Ghz - 580 @ 1025/2130. siriq111: Link
Score: 3,654,099. FX-8350 @ 4.5Ghz - 570 @ 863/1951. siriq111 Link


Win10
- Mantle - 720P

Score: 33,113,784. 5960x @4Ghz - Fury_X @ Stock. AMDMatt: Link
Score: 27,372,267. 5820K @4.6Ghz - Fury X @ ?????. uksoldierboy: Link
Score: 21,425,637. 4790k @4.8Ghz - 290 @ 1170/1600. MadMatty: Link
Score: 20,217,273. 3770K @4.4Ghz - 290 @ 1100/1400. win8.1: Link
Score: 15,262,879. FX-9590 @ 4.7Ghz - 290 @ 1040/1350. Humbug: Link
Score: 14,503,386. 4790k @stock - Fur-X @stock. savagesam117: Link


Win10 - DX11 ST - 720P

Score: 2,533,054. 5820k @stock - 980 @ 1329/1753. MasterOC: Link
Score: 2,260,823. 4770K @4.7Ghz - 980Ti 1530/4000. Robzere31: Link
Score: 2,236,973 . 4690K @ 4.7Ghz - 970 @ 1550/1953. Humbug: Link
Score: 2,148,984. 2700K @ 4.7Ghz - 780TI @ 1202/1853. PieEater: Link
Score: 2,027.011. FX-8350 @ 4.7Ghz - 570 @ 864/1951. siriq111 Link
Score
: 1,443,578 . 5960x @4Ghz - Fury_X @ Stock. AMDMatt: Link
Score: 1,356,705. 5820K @4.6Ghz - Fury X @ ?????. uksoldierboy: Link
Score: 1,347,127. FX-9590 @ 4.7Ghz - 970 @ 1450/1828. Humbug: Link
Score: 1,233,983. 4790k @4.8Ghz - 290 @ 1170/1600. MadMatty: Link
Score: 1,135,766. 3770K @4.4Ghz - 290 @ 1100/1400. win8.1: Link
Score: 1,018,277. 4790k @stock - Fur-X @stock. savagesam117: Link
Score: 881,618. FX-9590 @ 4.7Ghz - 290 @ 1040/1350. Humbug: Link
 
Last edited:
Win8.1 - Mantle - 720P

Score: 17,545,368. 3770K @ 4.5Ghz - 290X x2 @ 1000/1250. tommybhoy: Link
Score: 15,679,755. 3770K @ 4.4Ghz - 290X x2 @ 1000/1250. adwol48: Link
Score: 16,211,641. 4790k @4.8Ghz - 290 @ 1170/1600. MadMatty: Link
Score: 14,405,912. FX-9590 @4.7Ghz - 290 @ 1075/1375. Humbug: Link
Score: 13,730,435. FX-8320 @ 4.5Ghz - 280X x2 @ 1090/1550. thebennyboy: Link
Score: 2,432,038. Opteron 180 @2.9Ghz - R7 250 @ 1100/1200. MadMatty: Link


Win8.1 - DX11 - 720P

Score: 975,594 . 3770K @ 4.5Ghz - 290X x2 @ 1000/1250. tommybhoy: Link
Score: 1,052,212. 4790k @4.8Ghz - 290 @ 1170/1600. MadMatty: Link
Score: 245,424. Opteron 180 @2.9Ghz - R7 250 @ 1100/1200. MadMatty: Link
 
Last edited:
http://www.futuremark.com/pressreleases

The purpose of the test is to compare the relative performance of different APIs on a single system, rather than the absolute performance of different systems. The API Overhead feature test is not a general-purpose GPU benchmark, and it should not be used to compare graphics cards from different vendors. (We are working on a DirectX 12 benchmark with game-like workloads, which we expect to release soon after the public launch of Windows 10.)
 
Last edited:
Not even that. The only thing you can compare results to, is other results obtained on your system. It's not a benchmark, or a ranking tool.
 
would like to test my gtx780 which is currently installed in my windows 10 machine with dx12 but it wont launch that portion of the test :(

not trying to rank people its just interesting to see how efficiently mantle or dx12 work against each other. and I suppose see how effected it could be by cpu clock speed/architecure
 
Last edited:
Not even that. The only thing you can compare results to, is other results obtained on your system. It's not a benchmark, or a ranking tool.

Different CPU's with different performance levels be it vendors or overclocks result in different scores.

would like to test my gtx780 which is currently installed in my windows 10 machine with dx12 but it wont launch that portion of the test :(

Have you updated it? it needs to be build 10041, it should tell you what build it is in the water mark.
Also, Nvidia DX12 Drivers?
 
would like to test my gtx780 which is currently installed in my windows 10 machine with dx12 but it wont launch that portion of the test :(

not trying to rank people its just interesting to see how efficiently mantle or dx12 work against each other. and I suppose see how effected it could be by cpu clock speed/architecure

This test isn't going to tell you that. FM themselves have stated that it is only of use for testing the overhead of different API's on the exact same system. Don't try and compare results with anyone else.
 
The proper use of the test is to compare the relative performance of each API on a
single system, rather than the absolute performance of different systems.

The focus on single-system testing is one reason why the API Overhead test is called a
feature test rather than a benchmark.

Futuremark is developing a DirectX 12 benchmark that will be available after the public
launch of Windows 10. That test will be designed specifically to compare the performance of
different vendors' hardware with game-like workloads.
http://s3.amazonaws.com/download-aws.futuremark.com/3DMark_Technical_Guide.pdf

I dont know if they stated it to play nice with vendors or there are other more technical reasons
 
There has been a lot of DX12 results noise with this application on the net, so they exists.

Could it be that Kepler doesn't have a Driver yet?

well found a press release about the driver i need but i'm sure i tried to download it through windows update before and it pretty much made the card stop working.
 
Back
Top Bottom