

You are using an out of date browser. It may not display this or other websites correctly.
You should upgrade or use an alternative browser.
You should upgrade or use an alternative browser.
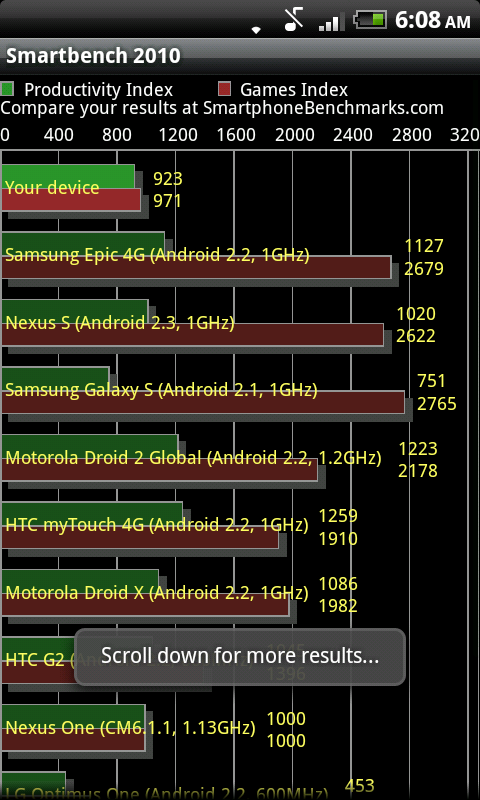
***** Smartbench 2010 Benchmark Thread *****
- Thread starter buchtis
- Start date
More options
Thread starter's postsAssociate
- Joined
- 8 Nov 2008
- Posts
- 488
- Location
- Gillingham
San Francisco on FLB-Froyo G2
pi: 464
gi: 664
pi: 464
gi: 664
Soldato
- Joined
- 25 Sep 2008
- Posts
- 6,767
- Location
- Orsett, Essex
HTC Desire on LeeDroid 2.3d @ 1190Mhz
I read this at the start of the thread:
Is it and how?
I'm not sure if Smartbench is better optimized but if there is one thing I was trying to get right from the get go was to get the weightings of CPU, GPU and I/O performances realistic in comparison to the real applications we use every day. This is another reason why I ended up with 2 indexes - one for productivity users (who benefit more from faster CPUs) and gaming users (who benefit more from raw GPU power).
Have a look at the Quadrant Advanced chart for any phones. And look at the length of each sub-bars. You will find that on some phones, a single bar totally dominates, especially in the area of I/O. If your app relies on I/O 70% of the time, then this is accurate but typical apps don't have this kind of usage pattern. Quadrant weighting made sense back when HTC Magic was the norm, but right now, its a bit unrealistic. Smartbench 2010 uses Nexus One as the baseline rather than HTC Magic. Smartbench 2011 (to be released in few months) will use higher spec phone as the baseline, once again to remove any potential weighting issues.
EDITED: Meant to say "Smartbench 2011"
Last edited:
Here's an article that talks about benchmarking Hummingbird vs 2nd Gen Snapdragon processors. There's also a section on Smartbench vs Quadrant. It should be interesting to read ") http://bit.ly/ganTCi
http://bit.ly/ganTCi
http://bit.ly/ganTCi