

You are using an out of date browser. It may not display this or other websites correctly.
You should upgrade or use an alternative browser.
You should upgrade or use an alternative browser.
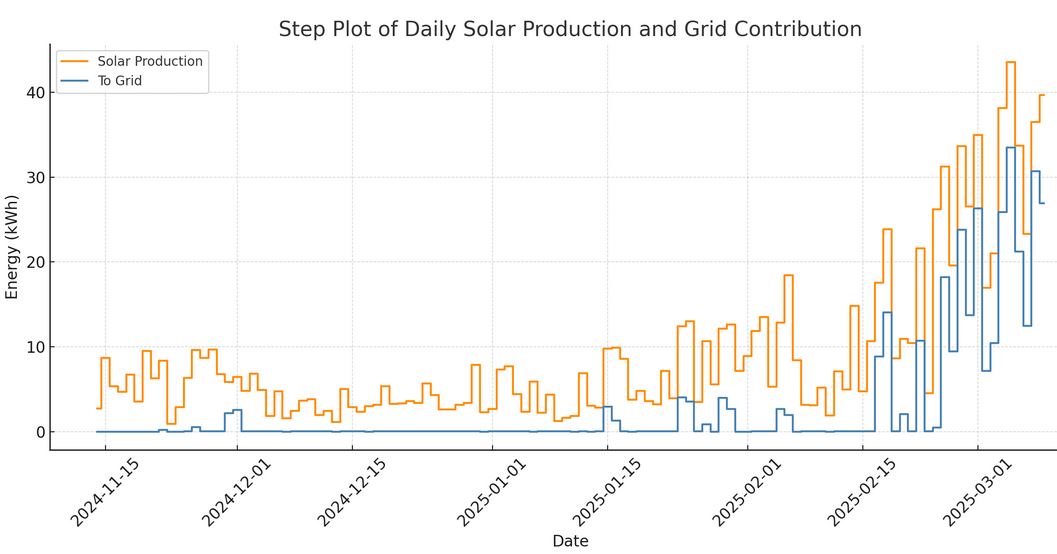
Solar panel production figures
- Thread starter Ron-ski
- Start date
More options
Thread starter's postsAssociate
- Joined
- 22 Dec 2010
- Posts
- 560
- Location
- West Midlands
11.06 kWh for us.
I might have over did it on the export tonight.projected 14.22, generated 15.44, exported 5.7 solar and some battery to be done later.
I did 5.1kwh earlier for a total of 10.8 exported.
I got down to under 150wh left in the battery as charging kicked on at 23.31.
Nailed it

Last edited: