

Firstly, sorry if this is the wrong board to post on but I couldn't instantly see a better suited section.
I recently (last 2 weeks) bought this system with a 120GB SSD and a GTX670 card.
Initially it was running well but had issues with boot up and hibernation. I called OC about this and was advised to update the BIOS firmware. The mobo is a Gigabyte Z77-D3H. The flash took the FW from F12 to F14 and that corrected the boot/hibernation issues. Obviously, this required the OC to be reapplied, which a nice chap talked me through.
However, now I have developed random BSOD error issues when running the only 2 apps I currently have on the system (not including games which run perfectly). These apps are Steam and uTorrent and both have to be actively downloading to cause the BSOD.
I have multiple minidumps proving that these apps initiated the crash but there is no logic to the system files involved. So far these cover the following:
^ That's a few of them, I have 15 to 20 more from when the 2 apps in question were running but don't want to spam the board.
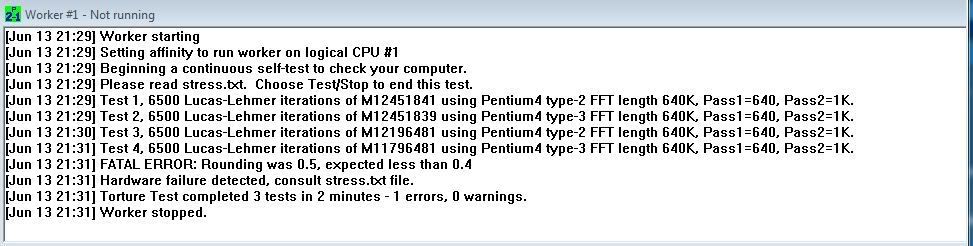
I also noted that when using OCs suggested method of checking the overclock by running CPUID and Prime95, Prime95 reports that Worker#1 :
I'm pretty sure it's not temp related, when idle all 4 cores are 28 degrees and maxed at 52 degrees under load. I'm partially sure it's not RAM related as Memtest has been run over night with no errors.
I'm lost where to look now. Could the OC settings, applied after the BIOS flash be causing this? Could Speedstep be interfering with the OC?
FWIW, this is a brand new install (as sent by OC), no additional hardware added and all Win 7 updates applied and the latest Geforce Drivers.
I am resigned to call OC again but that won't be until Saturday, so any more insight from anyone here will be greatly welcomed.
Thank you and sorry for the long post.
TL;DR - System BSOD'ing, halp!
I recently (last 2 weeks) bought this system with a 120GB SSD and a GTX670 card.
Initially it was running well but had issues with boot up and hibernation. I called OC about this and was advised to update the BIOS firmware. The mobo is a Gigabyte Z77-D3H. The flash took the FW from F12 to F14 and that corrected the boot/hibernation issues. Obviously, this required the OC to be reapplied, which a nice chap talked me through.
However, now I have developed random BSOD error issues when running the only 2 apps I currently have on the system (not including games which run perfectly). These apps are Steam and uTorrent and both have to be actively downloading to cause the BSOD.
I have multiple minidumps proving that these apps initiated the crash but there is no logic to the system files involved. So far these cover the following:
KMODE_EXCEPTION_NOT_HANDLED (1e)
This is a very common bugcheck. Usually the exception address pinpoints
the driver/function that caused the problem. Always note this address
as well as the link date of the driver/image that contains this address.
Arguments:
Arg1: ffffffffc0000005, The exception code that was not handled
Arg2: fffff88006c077bd, The address that the exception occurred at
Arg3: 0000000000000000, Parameter 0 of the exception
Arg4: ffffffffffffffff, Parameter 1 of the exception
Debugging Details:
------------------
EXCEPTION_CODE: (NTSTATUS) 0xc0000005 - The instruction at 0x%08lx referenced memory at 0x%08lx. The memory could not be %s.
FAULTING_IP:
L1C62x64+77bd
fffff880`06c077bd c3 ret
EXCEPTION_PARAMETER1: 0000000000000000
EXCEPTION_PARAMETER2: ffffffffffffffff
READ_ADDRESS: GetPointerFromAddress: unable to read from fffff80002f08100
ffffffffffffffff
ERROR_CODE: (NTSTATUS) 0xc0000005 - The instruction at 0x%08lx referenced memory at 0x%08lx. The memory could not be %s.
BUGCHECK_STR: 0x1E_c0000005
CUSTOMER_CRASH_COUNT: 1
DEFAULT_BUCKET_ID: VISTA_DRIVER_FAULT
PROCESS_NAME: System
CURRENT_IRQL: 2
LAST_CONTROL_TRANSFER: from fffff80002d23db8 to fffff80002cd91c0
STACK_TEXT:
fffff800`00b99e58 fffff800`02d23db8 : 00000000`0000001e ffffffff`c0000005 fffff880`06c077bd 00000000`00000000 : nt!KeBugCheckEx
fffff800`00b99e60 fffff800`02cd8842 : fffff800`00b9a638 fffffa80`07954a40 fffff800`00b9a6e0 00b9a8f0`00000000 : nt! ?? ::FNODOBFM::`string'+0x48d3d
fffff800`00b9a500 fffff800`02cd714a : fffff800`02e4be80 fffff780`00000320 00000000`0001c778 fffff800`02ce2ce7 : nt!KiExceptionDispatch+0xc2
fffff800`00b9a6e0 fffff880`06c077bd : 0780bd60`fffff880 019164e9`fffffa80 00000000`fffff880 06d54510`00000000 : nt!KiGeneralProtectionFault+0x10a
fffff800`00b9a87c 0780bd60`fffff880 : 019164e9`fffffa80 00000000`fffff880 06d54510`00000000 0780bd60`fffffa80 : L1C62x64+0x77bd
fffff800`00b9a884 019164e9`fffffa80 : 00000000`fffff880 06d54510`00000000 0780bd60`fffffa80 078ed630`fffffa80 : 0x780bd60`fffff880
fffff800`00b9a88c 00000000`fffff880 : 06d54510`00000000 0780bd60`fffffa80 078ed630`fffffa80 06c042e4`fffffa80 : 0x19164e9`fffffa80
fffff800`00b9a894 06d54510`00000000 : 0780bd60`fffffa80 078ed630`fffffa80 06c042e4`fffffa80 00000000`fffffa80 : 0xfffff880
fffff800`00b9a89c 0780bd60`fffffa80 : 078ed630`fffffa80 06c042e4`fffffa80 00000000`fffffa80 00000000`00000000 : 0x6d54510`00000000
fffff800`00b9a8a4 078ed630`fffffa80 : 06c042e4`fffffa80 00000000`fffffa80 00000000`00000000 07954a40`00000000 : 0x780bd60`fffffa80
fffff800`00b9a8ac 06c042e4`fffffa80 : 00000000`fffffa80 00000000`00000000 07954a40`00000000 07243938`fffffa80 : 0x78ed630`fffffa80
fffff800`00b9a8b4 00000000`fffffa80 : 00000000`00000000 07954a40`00000000 07243938`fffffa80 06c06bdf`fffffa80 : 0x6c042e4`fffffa80
fffff800`00b9a8bc 00000000`00000000 : 07954a40`00000000 07243938`fffffa80 06c06bdf`fffffa80 00000036`fffff880 : 0xfffffa80
STACK_COMMAND: kb
FOLLOWUP_IP:
L1C62x64+77bd
fffff880`06c077bd c3 ret
SYMBOL_STACK_INDEX: 4
SYMBOL_NAME: L1C62x64+77bd
FOLLOWUP_NAME: MachineOwner
MODULE_NAME: L1C62x64
IMAGE_NAME: L1C62x64.sys
DEBUG_FLR_IMAGE_TIMESTAMP: 4e38e8d5
FAILURE_BUCKET_ID: X64_0x1E_c0000005_L1C62x64+77bd
BUCKET_ID: X64_0x1E_c0000005_L1C62x64+77bd
Followup: MachineOwner
------------------------------------------------------------------------
CLOCK_WATCHDOG_TIMEOUT (101)
An expected clock interrupt was not received on a secondary processor in an
MP system within the allocated interval. This indicates that the specified
processor is hung and not processing interrupts.
Arguments:
Arg1: 0000000000000031, Clock interrupt time out interval in nominal clock ticks.
Arg2: 0000000000000000, 0.
Arg3: fffff880009ea180, The PRCB address of the hung processor.
Arg4: 0000000000000001, 0.
Debugging Details:
------------------
BUGCHECK_STR: CLOCK_WATCHDOG_TIMEOUT_4_PROC
CUSTOMER_CRASH_COUNT: 1
DEFAULT_BUCKET_ID: VISTA_DRIVER_FAULT
PROCESS_NAME: System
CURRENT_IRQL: d
STACK_TEXT:
fffff880`0330ed68 fffff800`02d26f3a : 00000000`00000101 00000000`00000031 00000000`00000000 fffff880`009ea180 : nt!KeBugCheckEx
fffff880`0330ed70 fffff800`02cd9ce7 : fffff880`00000000 fffff800`00000001 00000000`00026160 fffff880`00000006 : nt! ?? ::FNODOBFM::`string'+0x4e2e
fffff880`0330ee00 fffff800`02c12895 : fffff800`02c38460 fffff880`0330efb0 fffff800`02c38460 00000000`00000000 : nt!KeUpdateSystemTime+0x377
fffff880`0330ef00 fffff800`02ccc713 : 00000000`547a3db3 fffff800`02e42e80 00000000`00000000 00000000`00000000 : hal!HalpHpetClockInterrupt+0x8d
fffff880`0330ef30 fffff800`02cd4ff6 : fffff800`02e42e80 fffff800`00000001 00000000`00000000 fffff880`0330f1c8 : nt!KiInterruptDispatchNoLock+0x163
fffff880`0330f0c0 fffff800`02cef951 : 00000000`00000000 00000000`00000020 00000000`00000001 00000000`00000001 : nt!KeFlushMultipleRangeTb+0x266
fffff880`0330f190 fffff800`02cf2398 : 00000000`00000020 fffff880`0330f300 fffff8a0`02d2d000 00000000`00000001 : nt!MiFlushTbAsNeeded+0x1d1
fffff880`0330f2a0 fffff800`02df8f86 : 00000000`00020000 fffffa80`06662000 00000000`00000001 fffff880`0f27b37d : nt!MiAllocatePagedPoolPages+0x4cc
fffff880`0330f3c0 fffff800`02cf00b0 : 00000000`00020000 fffffa80`06662000 00000000`00000001 00000000`0000005e : nt!MiAllocatePoolPages+0x906
fffff880`0330f500 fffff800`02dfb90e : 00000000`00000000 fffff880`00f0522b 00000000`00000000 00000000`00020000 : nt!ExpAllocateBigPool+0xb0
fffff880`0330f5f0 fffff880`01178c9d : fffffa80`079b8370 fffffa80`068be910 fffff880`0330fab0 fffffa80`079b8000 : nt!ExAllocatePoolWithTag+0x82e
fffff880`0330f6e0 fffff880`011793ed : fffffa80`0929b540 fffff800`02cd77e3 fffffa80`20206f49 00000009`d51295ec : cng!GatherRandomKey+0x3d
fffff880`0330faa0 fffff800`02fc264d : 00000000`00000001 00000000`00000001 fffffa80`07c4a820 fffffa80`066e8b50 : cng!scavengingWorkItemRoutine+0x3d
fffff880`0330fb40 fffff800`02cd9851 : fffff800`02e6d200 fffff800`02fc2601 fffffa80`066e8b00 fffffa80`066e8b50 : nt!IopProcessWorkItem+0x3d
fffff880`0330fb70 fffff800`02f66e6a : 00000000`00000000 fffffa80`066e8b50 00000000`00000080 fffffa80`066d5b30 : nt!ExpWorkerThread+0x111
fffff880`0330fc00 fffff800`02cc0f06 : fffff880`02f65180 fffffa80`066e8b50 fffff880`02f6ffc0 00000000`00000000 : nt!PspSystemThreadStartup+0x5a
fffff880`0330fc40 00000000`00000000 : 00000000`00000000 00000000`00000000 00000000`00000000 00000000`00000000 : nt!KxStartSystemThread+0x16
STACK_COMMAND: kb
SYMBOL_NAME: ANALYSIS_INCONCLUSIVE
FOLLOWUP_NAME: MachineOwner
MODULE_NAME: Unknown_Module
IMAGE_NAME: Unknown_Image
DEBUG_FLR_IMAGE_TIMESTAMP: 0
FAILURE_BUCKET_ID: X64_CLOCK_WATCHDOG_TIMEOUT_4_PROC_ANALYSIS_INCONCLUSIVE
BUCKET_ID: X64_CLOCK_WATCHDOG_TIMEOUT_4_PROC_ANALYSIS_INCONCLUSIVE
Followup: MachineOwner
-------------------------------------------------------------------------
SYSTEM_SERVICE_EXCEPTION (3b)
An exception happened while executing a system service routine.
Arguments:
Arg1: 00000000c000001d, Exception code that caused the bugcheck
Arg2: fffff80002c81ae3, Address of the instruction which caused the bugcheck
Arg3: fffff88009bb1f60, Address of the context record for the exception that caused the bugcheck
Arg4: 0000000000000000, zero.
Debugging Details:
------------------
EXCEPTION_CODE: (NTSTATUS) 0xc000001d - {EXCEPTION} Illegal Instruction An attempt was made to execute an illegal instruction.
FAULTING_IP:
nt!KiCommitThreadWait+a3
fffff800`02c81ae3 f0480fbaaf9044000000 lock bts qword ptr [rdi+4490h],0
CONTEXT: fffff88009bb1f60 -- (.cxr 0xfffff88009bb1f60)
rax=0000000000000001 rbx=fffffa80086d6740 rcx=fffffa80086d6700
rdx=0000000000000001 rsi=fffffa80086d6800 rdi=fffff80002dfee80
rip=fffff80002c81ae3 rsp=fffff88009bb2940 rbp=fffff88009bb2ab8
r8=000000000000007a r9=fffff88009bb2ab8 r10=0000000000000001
r11=fffff80002dfee80 r12=0000000000000000 r13=fffffa80086d6848
r14=0000000000000001 r15=fffffa80086d6848
iopl=0 nv up ei pl nz na pe nc
cs=0010 ss=0018 ds=002b es=002b fs=0053 gs=002b efl=00010202
nt!KiCommitThreadWait+0xa3:
fffff800`02c81ae3 f0480fbaaf9044000000 lock bts qword ptr [rdi+4490h],0 ds:002b:fffff800`02e03310=????????????????
Resetting default scope
CUSTOMER_CRASH_COUNT: 1
DEFAULT_BUCKET_ID: VISTA_DRIVER_FAULT
BUGCHECK_STR: 0x3B
PROCESS_NAME: Steam.exe
CURRENT_IRQL: 2
LAST_CONTROL_TRANSFER: from 0000000000000000 to fffff80002c81ae3
STACK_TEXT:
fffff880`09bb2940 00000000`00000000 : 00000000`00000000 00000000`00000000 00000000`00000000 00000000`00000000 : nt!KiCommitThreadWait+0xa3
FOLLOWUP_IP:
nt!KiCommitThreadWait+a3
fffff800`02c81ae3 f0480fbaaf9044000000 lock bts qword ptr [rdi+4490h],0
SYMBOL_STACK_INDEX: 0
SYMBOL_NAME: nt!KiCommitThreadWait+a3
FOLLOWUP_NAME: MachineOwner
MODULE_NAME: nt
IMAGE_NAME: ntkrnlmp.exe
DEBUG_FLR_IMAGE_TIMESTAMP: 4f76721c
STACK_COMMAND: .cxr 0xfffff88009bb1f60 ; kb
FAILURE_BUCKET_ID: X64_0x3B_nt!KiCommitThreadWait+a3
BUCKET_ID: X64_0x3B_nt!KiCommitThreadWait+a3
Followup: MachineOwner
--------------------------------------------------------------------------
KMODE_EXCEPTION_NOT_HANDLED (1e)
This is a very common bugcheck. Usually the exception address pinpoints
the driver/function that caused the problem. Always note this address
as well as the link date of the driver/image that contains this address.
Arguments:
Arg1: 0000000000000000, The exception code that was not handled
Arg2: 0000000000000000, The address that the exception occurred at
Arg3: 0000000000000000, Parameter 0 of the exception
Arg4: 0000000000000000, Parameter 1 of the exception
Debugging Details:
------------------
EXCEPTION_CODE: (Win32) 0 (0) - The operation completed successfully.
FAULTING_IP:
+3962646337633931
00000000`00000000 ?? ???
EXCEPTION_PARAMETER1: 0000000000000000
EXCEPTION_PARAMETER2: 0000000000000000
ERROR_CODE: (NTSTATUS) 0 - STATUS_WAIT_0
BUGCHECK_STR: 0x1E_0
CUSTOMER_CRASH_COUNT: 1
DEFAULT_BUCKET_ID: VISTA_DRIVER_FAULT
PROCESS_NAME: System
CURRENT_IRQL: 2
EXCEPTION_RECORD: fffff80000b9c408 -- (.exr 0xfffff80000b9c408)
ExceptionAddress: fffff88006b5e149 (dxgmms1!VidSchiInterlockedRemoveEntryList+0x0000000000000015)
ExceptionCode: c0000005 (Access violation)
ExceptionFlags: 00000000
NumberParameters: 2
Parameter[0]: 0000000000000000
Parameter[1]: ffffffffffffffff
Attempt to read from address ffffffffffffffff
TRAP_FRAME: fffff80000b9c4b0 -- (.trap 0xfffff80000b9c4b0)
NOTE: The trap frame does not contain all registers.
Some register values may be zeroed or incorrect.
rax=000000000000e610 rbx=0000000000000000 rcx=fffffa8007738ba8
rdx=fffff80000b9c660 rsi=0000000000000000 rdi=0000000000000000
rip=fffff88006b5e149 rsp=fffff80000b9c640 rbp=fffffa8007738ba8
r8=fffffa8007c34790 r9=0000000000000000 r10=0000000000000000
r11=0000000000000002 r12=0000000000000000 r13=0000000000000000
r14=0000000000000000 r15=0000000000000000
iopl=0 nv up ei ng nz na pe nc
dxgmms1!VidSchiInterlockedRemoveEntryList+0x15:
fffff880`06b5e149 ff1551110000 call qword ptr [dxgmms1!_imp_KeAcquireInStackQueuedSpinLock (fffff880`06b5f2a0)] ds:fffff880`06b5f2a0=0000000000042cdc
Resetting default scope
LAST_CONTROL_TRANSFER: from fffff80002c7dbbe to fffff80002c86190
STACK_TEXT:
fffff800`00b9b4e8 fffff800`02c7dbbe : 00000000`00000000 00000000`00000000 fffff800`00b9bc60 fffff800`02cb1180 : nt!KeBugCheck
fffff800`00b9b4f0 fffff800`02cb0e4d : fffff800`02e8c770 fffff800`02dc92f0 fffff800`02c07000 fffff800`00b9c408 : nt!KiKernelCalloutExceptionHandler+0xe
fffff800`00b9b520 fffff800`02cafc25 : fffff800`02dccfac fffff800`00b9b598 fffff800`00b9c408 fffff800`02c07000 : nt!RtlpExecuteHandlerForException+0xd
fffff800`00b9b550 fffff800`02cc0bb1 : fffff800`00b9c408 fffff800`00b9bc60 fffff800`00000000 fffffa80`00000004 : nt!RtlDispatchException+0x415
fffff800`00b9bc30 fffff800`02c85842 : fffff800`00b9c408 fffffa80`07c2f6e8 fffff800`00b9c4b0 fffffa80`085ee000 : nt!KiDispatchException+0x135
fffff800`00b9c2d0 fffff800`02c8414a : fffffa80`07c34570 fffff880`06b5a095 fffffa80`07738410 00000003`00000000 : nt!KiExceptionDispatch+0xc2
fffff800`00b9c4b0 fffff880`06b5e149 : 00000000`00000000 00000000`00000000 00000000`00000000 00000000`00000000 : nt!KiGeneralProtectionFault+0x10a
fffff800`00b9c640 fffff880`06b59709 : fffffa80`07c2f6e8 fffffa80`07738410 fffffa80`07738b80 00000000`00000002 : dxgmms1!VidSchiInterlockedRemoveEntryList+0x15
fffff800`00b9c690 fffff880`06b5836b : fffffa80`07c2f6e0 fffffa80`07be4010 fffffa80`085ee000 00000000`00000000 : dxgmms1!VidSchiFreeQueuePacket+0x51
fffff800`00b9c6e0 fffff880`06b577da : fffffa80`00000001 fffffa80`00000000 00000000`00000002 fffffa80`06c1d9a0 : dxgmms1!VidSchiProcessCompletedQueuePacketInternal+0x443
fffff800`00b9c7a0 fffff880`06b56e00 : fffffa80`00000000 fffff880`0f20db8d 00000000`00000000 00000000`00000001 : dxgmms1!VidSchiProcessDpcCompletedPacket+0x3b6
fffff800`00b9c840 fffff880`06b56c4c : 00000000`00000001 fffffa80`07738410 00000000`00000000 00000000`00000000 : dxgmms1!VidSchDdiNotifyDpcWorker+0x198
fffff800`00b9c890 fffff880`06a5d1cf : fffffa80`073a2330 00000000`00000000 00000000`00000022 00000000`00000000 : dxgmms1!VidSchDdiNotifyDpc+0x94
fffff800`00b9c8e0 fffff880`0f0f87f0 : fffffa80`0757a000 fffffa80`0757a000 00000000`00000000 00000000`00000000 : dxgkrnl!DxgNotifyDpcCB+0x77
fffff800`00b9c910 fffffa80`0757a000 : fffffa80`0757a000 00000000`00000000 00000000`00000000 fffff880`0f0f8783 : nvlddmkm+0xd97f0
fffff800`00b9c918 fffffa80`0757a000 : 00000000`00000000 00000000`00000000 fffff880`0f0f8783 fffffa80`0757a000 : 0xfffffa80`0757a000
fffff800`00b9c920 00000000`00000000 : 00000000`00000000 fffff880`0f0f8783 fffffa80`0757a000 00000000`00000000 : 0xfffffa80`0757a000
STACK_COMMAND: kb
FOLLOWUP_IP:
dxgmms1!VidSchiInterlockedRemoveEntryList+15
fffff880`06b5e149 ff1551110000 call qword ptr [dxgmms1!_imp_KeAcquireInStackQueuedSpinLock (fffff880`06b5f2a0)]
SYMBOL_STACK_INDEX: 7
SYMBOL_NAME: dxgmms1!VidSchiInterlockedRemoveEntryList+15
FOLLOWUP_NAME: MachineOwner
MODULE_NAME: dxgmms1
IMAGE_NAME: dxgmms1.sys
DEBUG_FLR_IMAGE_TIMESTAMP: 4ce799c1
FAILURE_BUCKET_ID: X64_0x1E_0_dxgmms1!VidSchiInterlockedRemoveEntryList+15
BUCKET_ID: X64_0x1E_0_dxgmms1!VidSchiInterlockedRemoveEntryList+15
Followup: MachineOwner
This is a very common bugcheck. Usually the exception address pinpoints
the driver/function that caused the problem. Always note this address
as well as the link date of the driver/image that contains this address.
Arguments:
Arg1: ffffffffc0000005, The exception code that was not handled
Arg2: fffff88006c077bd, The address that the exception occurred at
Arg3: 0000000000000000, Parameter 0 of the exception
Arg4: ffffffffffffffff, Parameter 1 of the exception
Debugging Details:
------------------
EXCEPTION_CODE: (NTSTATUS) 0xc0000005 - The instruction at 0x%08lx referenced memory at 0x%08lx. The memory could not be %s.
FAULTING_IP:
L1C62x64+77bd
fffff880`06c077bd c3 ret
EXCEPTION_PARAMETER1: 0000000000000000
EXCEPTION_PARAMETER2: ffffffffffffffff
READ_ADDRESS: GetPointerFromAddress: unable to read from fffff80002f08100
ffffffffffffffff
ERROR_CODE: (NTSTATUS) 0xc0000005 - The instruction at 0x%08lx referenced memory at 0x%08lx. The memory could not be %s.
BUGCHECK_STR: 0x1E_c0000005
CUSTOMER_CRASH_COUNT: 1
DEFAULT_BUCKET_ID: VISTA_DRIVER_FAULT
PROCESS_NAME: System
CURRENT_IRQL: 2
LAST_CONTROL_TRANSFER: from fffff80002d23db8 to fffff80002cd91c0
STACK_TEXT:
fffff800`00b99e58 fffff800`02d23db8 : 00000000`0000001e ffffffff`c0000005 fffff880`06c077bd 00000000`00000000 : nt!KeBugCheckEx
fffff800`00b99e60 fffff800`02cd8842 : fffff800`00b9a638 fffffa80`07954a40 fffff800`00b9a6e0 00b9a8f0`00000000 : nt! ?? ::FNODOBFM::`string'+0x48d3d
fffff800`00b9a500 fffff800`02cd714a : fffff800`02e4be80 fffff780`00000320 00000000`0001c778 fffff800`02ce2ce7 : nt!KiExceptionDispatch+0xc2
fffff800`00b9a6e0 fffff880`06c077bd : 0780bd60`fffff880 019164e9`fffffa80 00000000`fffff880 06d54510`00000000 : nt!KiGeneralProtectionFault+0x10a
fffff800`00b9a87c 0780bd60`fffff880 : 019164e9`fffffa80 00000000`fffff880 06d54510`00000000 0780bd60`fffffa80 : L1C62x64+0x77bd
fffff800`00b9a884 019164e9`fffffa80 : 00000000`fffff880 06d54510`00000000 0780bd60`fffffa80 078ed630`fffffa80 : 0x780bd60`fffff880
fffff800`00b9a88c 00000000`fffff880 : 06d54510`00000000 0780bd60`fffffa80 078ed630`fffffa80 06c042e4`fffffa80 : 0x19164e9`fffffa80
fffff800`00b9a894 06d54510`00000000 : 0780bd60`fffffa80 078ed630`fffffa80 06c042e4`fffffa80 00000000`fffffa80 : 0xfffff880
fffff800`00b9a89c 0780bd60`fffffa80 : 078ed630`fffffa80 06c042e4`fffffa80 00000000`fffffa80 00000000`00000000 : 0x6d54510`00000000
fffff800`00b9a8a4 078ed630`fffffa80 : 06c042e4`fffffa80 00000000`fffffa80 00000000`00000000 07954a40`00000000 : 0x780bd60`fffffa80
fffff800`00b9a8ac 06c042e4`fffffa80 : 00000000`fffffa80 00000000`00000000 07954a40`00000000 07243938`fffffa80 : 0x78ed630`fffffa80
fffff800`00b9a8b4 00000000`fffffa80 : 00000000`00000000 07954a40`00000000 07243938`fffffa80 06c06bdf`fffffa80 : 0x6c042e4`fffffa80
fffff800`00b9a8bc 00000000`00000000 : 07954a40`00000000 07243938`fffffa80 06c06bdf`fffffa80 00000036`fffff880 : 0xfffffa80
STACK_COMMAND: kb
FOLLOWUP_IP:
L1C62x64+77bd
fffff880`06c077bd c3 ret
SYMBOL_STACK_INDEX: 4
SYMBOL_NAME: L1C62x64+77bd
FOLLOWUP_NAME: MachineOwner
MODULE_NAME: L1C62x64
IMAGE_NAME: L1C62x64.sys
DEBUG_FLR_IMAGE_TIMESTAMP: 4e38e8d5
FAILURE_BUCKET_ID: X64_0x1E_c0000005_L1C62x64+77bd
BUCKET_ID: X64_0x1E_c0000005_L1C62x64+77bd
Followup: MachineOwner
------------------------------------------------------------------------
CLOCK_WATCHDOG_TIMEOUT (101)
An expected clock interrupt was not received on a secondary processor in an
MP system within the allocated interval. This indicates that the specified
processor is hung and not processing interrupts.
Arguments:
Arg1: 0000000000000031, Clock interrupt time out interval in nominal clock ticks.
Arg2: 0000000000000000, 0.
Arg3: fffff880009ea180, The PRCB address of the hung processor.
Arg4: 0000000000000001, 0.
Debugging Details:
------------------
BUGCHECK_STR: CLOCK_WATCHDOG_TIMEOUT_4_PROC
CUSTOMER_CRASH_COUNT: 1
DEFAULT_BUCKET_ID: VISTA_DRIVER_FAULT
PROCESS_NAME: System
CURRENT_IRQL: d
STACK_TEXT:
fffff880`0330ed68 fffff800`02d26f3a : 00000000`00000101 00000000`00000031 00000000`00000000 fffff880`009ea180 : nt!KeBugCheckEx
fffff880`0330ed70 fffff800`02cd9ce7 : fffff880`00000000 fffff800`00000001 00000000`00026160 fffff880`00000006 : nt! ?? ::FNODOBFM::`string'+0x4e2e
fffff880`0330ee00 fffff800`02c12895 : fffff800`02c38460 fffff880`0330efb0 fffff800`02c38460 00000000`00000000 : nt!KeUpdateSystemTime+0x377
fffff880`0330ef00 fffff800`02ccc713 : 00000000`547a3db3 fffff800`02e42e80 00000000`00000000 00000000`00000000 : hal!HalpHpetClockInterrupt+0x8d
fffff880`0330ef30 fffff800`02cd4ff6 : fffff800`02e42e80 fffff800`00000001 00000000`00000000 fffff880`0330f1c8 : nt!KiInterruptDispatchNoLock+0x163
fffff880`0330f0c0 fffff800`02cef951 : 00000000`00000000 00000000`00000020 00000000`00000001 00000000`00000001 : nt!KeFlushMultipleRangeTb+0x266
fffff880`0330f190 fffff800`02cf2398 : 00000000`00000020 fffff880`0330f300 fffff8a0`02d2d000 00000000`00000001 : nt!MiFlushTbAsNeeded+0x1d1
fffff880`0330f2a0 fffff800`02df8f86 : 00000000`00020000 fffffa80`06662000 00000000`00000001 fffff880`0f27b37d : nt!MiAllocatePagedPoolPages+0x4cc
fffff880`0330f3c0 fffff800`02cf00b0 : 00000000`00020000 fffffa80`06662000 00000000`00000001 00000000`0000005e : nt!MiAllocatePoolPages+0x906
fffff880`0330f500 fffff800`02dfb90e : 00000000`00000000 fffff880`00f0522b 00000000`00000000 00000000`00020000 : nt!ExpAllocateBigPool+0xb0
fffff880`0330f5f0 fffff880`01178c9d : fffffa80`079b8370 fffffa80`068be910 fffff880`0330fab0 fffffa80`079b8000 : nt!ExAllocatePoolWithTag+0x82e
fffff880`0330f6e0 fffff880`011793ed : fffffa80`0929b540 fffff800`02cd77e3 fffffa80`20206f49 00000009`d51295ec : cng!GatherRandomKey+0x3d
fffff880`0330faa0 fffff800`02fc264d : 00000000`00000001 00000000`00000001 fffffa80`07c4a820 fffffa80`066e8b50 : cng!scavengingWorkItemRoutine+0x3d
fffff880`0330fb40 fffff800`02cd9851 : fffff800`02e6d200 fffff800`02fc2601 fffffa80`066e8b00 fffffa80`066e8b50 : nt!IopProcessWorkItem+0x3d
fffff880`0330fb70 fffff800`02f66e6a : 00000000`00000000 fffffa80`066e8b50 00000000`00000080 fffffa80`066d5b30 : nt!ExpWorkerThread+0x111
fffff880`0330fc00 fffff800`02cc0f06 : fffff880`02f65180 fffffa80`066e8b50 fffff880`02f6ffc0 00000000`00000000 : nt!PspSystemThreadStartup+0x5a
fffff880`0330fc40 00000000`00000000 : 00000000`00000000 00000000`00000000 00000000`00000000 00000000`00000000 : nt!KxStartSystemThread+0x16
STACK_COMMAND: kb
SYMBOL_NAME: ANALYSIS_INCONCLUSIVE
FOLLOWUP_NAME: MachineOwner
MODULE_NAME: Unknown_Module
IMAGE_NAME: Unknown_Image
DEBUG_FLR_IMAGE_TIMESTAMP: 0
FAILURE_BUCKET_ID: X64_CLOCK_WATCHDOG_TIMEOUT_4_PROC_ANALYSIS_INCONCLUSIVE
BUCKET_ID: X64_CLOCK_WATCHDOG_TIMEOUT_4_PROC_ANALYSIS_INCONCLUSIVE
Followup: MachineOwner
-------------------------------------------------------------------------
SYSTEM_SERVICE_EXCEPTION (3b)
An exception happened while executing a system service routine.
Arguments:
Arg1: 00000000c000001d, Exception code that caused the bugcheck
Arg2: fffff80002c81ae3, Address of the instruction which caused the bugcheck
Arg3: fffff88009bb1f60, Address of the context record for the exception that caused the bugcheck
Arg4: 0000000000000000, zero.
Debugging Details:
------------------
EXCEPTION_CODE: (NTSTATUS) 0xc000001d - {EXCEPTION} Illegal Instruction An attempt was made to execute an illegal instruction.
FAULTING_IP:
nt!KiCommitThreadWait+a3
fffff800`02c81ae3 f0480fbaaf9044000000 lock bts qword ptr [rdi+4490h],0
CONTEXT: fffff88009bb1f60 -- (.cxr 0xfffff88009bb1f60)
rax=0000000000000001 rbx=fffffa80086d6740 rcx=fffffa80086d6700
rdx=0000000000000001 rsi=fffffa80086d6800 rdi=fffff80002dfee80
rip=fffff80002c81ae3 rsp=fffff88009bb2940 rbp=fffff88009bb2ab8
r8=000000000000007a r9=fffff88009bb2ab8 r10=0000000000000001
r11=fffff80002dfee80 r12=0000000000000000 r13=fffffa80086d6848
r14=0000000000000001 r15=fffffa80086d6848
iopl=0 nv up ei pl nz na pe nc
cs=0010 ss=0018 ds=002b es=002b fs=0053 gs=002b efl=00010202
nt!KiCommitThreadWait+0xa3:
fffff800`02c81ae3 f0480fbaaf9044000000 lock bts qword ptr [rdi+4490h],0 ds:002b:fffff800`02e03310=????????????????
Resetting default scope
CUSTOMER_CRASH_COUNT: 1
DEFAULT_BUCKET_ID: VISTA_DRIVER_FAULT
BUGCHECK_STR: 0x3B
PROCESS_NAME: Steam.exe
CURRENT_IRQL: 2
LAST_CONTROL_TRANSFER: from 0000000000000000 to fffff80002c81ae3
STACK_TEXT:
fffff880`09bb2940 00000000`00000000 : 00000000`00000000 00000000`00000000 00000000`00000000 00000000`00000000 : nt!KiCommitThreadWait+0xa3
FOLLOWUP_IP:
nt!KiCommitThreadWait+a3
fffff800`02c81ae3 f0480fbaaf9044000000 lock bts qword ptr [rdi+4490h],0
SYMBOL_STACK_INDEX: 0
SYMBOL_NAME: nt!KiCommitThreadWait+a3
FOLLOWUP_NAME: MachineOwner
MODULE_NAME: nt
IMAGE_NAME: ntkrnlmp.exe
DEBUG_FLR_IMAGE_TIMESTAMP: 4f76721c
STACK_COMMAND: .cxr 0xfffff88009bb1f60 ; kb
FAILURE_BUCKET_ID: X64_0x3B_nt!KiCommitThreadWait+a3
BUCKET_ID: X64_0x3B_nt!KiCommitThreadWait+a3
Followup: MachineOwner
--------------------------------------------------------------------------
KMODE_EXCEPTION_NOT_HANDLED (1e)
This is a very common bugcheck. Usually the exception address pinpoints
the driver/function that caused the problem. Always note this address
as well as the link date of the driver/image that contains this address.
Arguments:
Arg1: 0000000000000000, The exception code that was not handled
Arg2: 0000000000000000, The address that the exception occurred at
Arg3: 0000000000000000, Parameter 0 of the exception
Arg4: 0000000000000000, Parameter 1 of the exception
Debugging Details:
------------------
EXCEPTION_CODE: (Win32) 0 (0) - The operation completed successfully.
FAULTING_IP:
+3962646337633931
00000000`00000000 ?? ???
EXCEPTION_PARAMETER1: 0000000000000000
EXCEPTION_PARAMETER2: 0000000000000000
ERROR_CODE: (NTSTATUS) 0 - STATUS_WAIT_0
BUGCHECK_STR: 0x1E_0
CUSTOMER_CRASH_COUNT: 1
DEFAULT_BUCKET_ID: VISTA_DRIVER_FAULT
PROCESS_NAME: System
CURRENT_IRQL: 2
EXCEPTION_RECORD: fffff80000b9c408 -- (.exr 0xfffff80000b9c408)
ExceptionAddress: fffff88006b5e149 (dxgmms1!VidSchiInterlockedRemoveEntryList+0x0000000000000015)
ExceptionCode: c0000005 (Access violation)
ExceptionFlags: 00000000
NumberParameters: 2
Parameter[0]: 0000000000000000
Parameter[1]: ffffffffffffffff
Attempt to read from address ffffffffffffffff
TRAP_FRAME: fffff80000b9c4b0 -- (.trap 0xfffff80000b9c4b0)
NOTE: The trap frame does not contain all registers.
Some register values may be zeroed or incorrect.
rax=000000000000e610 rbx=0000000000000000 rcx=fffffa8007738ba8
rdx=fffff80000b9c660 rsi=0000000000000000 rdi=0000000000000000
rip=fffff88006b5e149 rsp=fffff80000b9c640 rbp=fffffa8007738ba8
r8=fffffa8007c34790 r9=0000000000000000 r10=0000000000000000
r11=0000000000000002 r12=0000000000000000 r13=0000000000000000
r14=0000000000000000 r15=0000000000000000
iopl=0 nv up ei ng nz na pe nc
dxgmms1!VidSchiInterlockedRemoveEntryList+0x15:
fffff880`06b5e149 ff1551110000 call qword ptr [dxgmms1!_imp_KeAcquireInStackQueuedSpinLock (fffff880`06b5f2a0)] ds:fffff880`06b5f2a0=0000000000042cdc
Resetting default scope
LAST_CONTROL_TRANSFER: from fffff80002c7dbbe to fffff80002c86190
STACK_TEXT:
fffff800`00b9b4e8 fffff800`02c7dbbe : 00000000`00000000 00000000`00000000 fffff800`00b9bc60 fffff800`02cb1180 : nt!KeBugCheck
fffff800`00b9b4f0 fffff800`02cb0e4d : fffff800`02e8c770 fffff800`02dc92f0 fffff800`02c07000 fffff800`00b9c408 : nt!KiKernelCalloutExceptionHandler+0xe
fffff800`00b9b520 fffff800`02cafc25 : fffff800`02dccfac fffff800`00b9b598 fffff800`00b9c408 fffff800`02c07000 : nt!RtlpExecuteHandlerForException+0xd
fffff800`00b9b550 fffff800`02cc0bb1 : fffff800`00b9c408 fffff800`00b9bc60 fffff800`00000000 fffffa80`00000004 : nt!RtlDispatchException+0x415
fffff800`00b9bc30 fffff800`02c85842 : fffff800`00b9c408 fffffa80`07c2f6e8 fffff800`00b9c4b0 fffffa80`085ee000 : nt!KiDispatchException+0x135
fffff800`00b9c2d0 fffff800`02c8414a : fffffa80`07c34570 fffff880`06b5a095 fffffa80`07738410 00000003`00000000 : nt!KiExceptionDispatch+0xc2
fffff800`00b9c4b0 fffff880`06b5e149 : 00000000`00000000 00000000`00000000 00000000`00000000 00000000`00000000 : nt!KiGeneralProtectionFault+0x10a
fffff800`00b9c640 fffff880`06b59709 : fffffa80`07c2f6e8 fffffa80`07738410 fffffa80`07738b80 00000000`00000002 : dxgmms1!VidSchiInterlockedRemoveEntryList+0x15
fffff800`00b9c690 fffff880`06b5836b : fffffa80`07c2f6e0 fffffa80`07be4010 fffffa80`085ee000 00000000`00000000 : dxgmms1!VidSchiFreeQueuePacket+0x51
fffff800`00b9c6e0 fffff880`06b577da : fffffa80`00000001 fffffa80`00000000 00000000`00000002 fffffa80`06c1d9a0 : dxgmms1!VidSchiProcessCompletedQueuePacketInternal+0x443
fffff800`00b9c7a0 fffff880`06b56e00 : fffffa80`00000000 fffff880`0f20db8d 00000000`00000000 00000000`00000001 : dxgmms1!VidSchiProcessDpcCompletedPacket+0x3b6
fffff800`00b9c840 fffff880`06b56c4c : 00000000`00000001 fffffa80`07738410 00000000`00000000 00000000`00000000 : dxgmms1!VidSchDdiNotifyDpcWorker+0x198
fffff800`00b9c890 fffff880`06a5d1cf : fffffa80`073a2330 00000000`00000000 00000000`00000022 00000000`00000000 : dxgmms1!VidSchDdiNotifyDpc+0x94
fffff800`00b9c8e0 fffff880`0f0f87f0 : fffffa80`0757a000 fffffa80`0757a000 00000000`00000000 00000000`00000000 : dxgkrnl!DxgNotifyDpcCB+0x77
fffff800`00b9c910 fffffa80`0757a000 : fffffa80`0757a000 00000000`00000000 00000000`00000000 fffff880`0f0f8783 : nvlddmkm+0xd97f0
fffff800`00b9c918 fffffa80`0757a000 : 00000000`00000000 00000000`00000000 fffff880`0f0f8783 fffffa80`0757a000 : 0xfffffa80`0757a000
fffff800`00b9c920 00000000`00000000 : 00000000`00000000 fffff880`0f0f8783 fffffa80`0757a000 00000000`00000000 : 0xfffffa80`0757a000
STACK_COMMAND: kb
FOLLOWUP_IP:
dxgmms1!VidSchiInterlockedRemoveEntryList+15
fffff880`06b5e149 ff1551110000 call qword ptr [dxgmms1!_imp_KeAcquireInStackQueuedSpinLock (fffff880`06b5f2a0)]
SYMBOL_STACK_INDEX: 7
SYMBOL_NAME: dxgmms1!VidSchiInterlockedRemoveEntryList+15
FOLLOWUP_NAME: MachineOwner
MODULE_NAME: dxgmms1
IMAGE_NAME: dxgmms1.sys
DEBUG_FLR_IMAGE_TIMESTAMP: 4ce799c1
FAILURE_BUCKET_ID: X64_0x1E_0_dxgmms1!VidSchiInterlockedRemoveEntryList+15
BUCKET_ID: X64_0x1E_0_dxgmms1!VidSchiInterlockedRemoveEntryList+15
Followup: MachineOwner
^ That's a few of them, I have 15 to 20 more from when the 2 apps in question were running but don't want to spam the board.
I also noted that when using OCs suggested method of checking the overclock by running CPUID and Prime95, Prime95 reports that Worker#1 :
I'm pretty sure it's not temp related, when idle all 4 cores are 28 degrees and maxed at 52 degrees under load. I'm partially sure it's not RAM related as Memtest has been run over night with no errors.
I'm lost where to look now. Could the OC settings, applied after the BIOS flash be causing this? Could Speedstep be interfering with the OC?
FWIW, this is a brand new install (as sent by OC), no additional hardware added and all Win 7 updates applied and the latest Geforce Drivers.
I am resigned to call OC again but that won't be until Saturday, so any more insight from anyone here will be greatly welcomed.
Thank you and sorry for the long post.
TL;DR - System BSOD'ing, halp!
")
 .
.") .
.