GANTT Chart help.

Caporegime
Joined
3 Jan 2006
Posts
25,209
Location
Chadderton, Oldham
Hi, for my assignment we have to make some gantt charts, now they're simple enough, well up to a certain degree, and I'm using excel, but the thing is, at the moment I have 3 sepeate gantt charts for the following

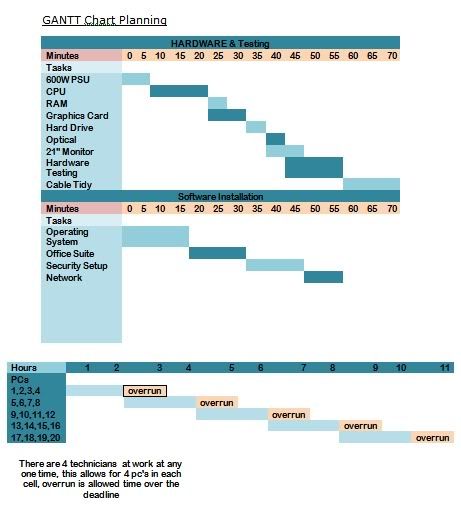
Computer parts - installation times, the time scaled on the chart is in minutes, 5,10,15,20 etc...

Another chart for software installation, on the same time scale as the above.

Then one for the computer upgrade on a whole, 4 technicians, each building 1 computer at a time, estimated time of building and installing the software is 1 hour 20mins, so I've had to put this into the chart, assuming that is the time for 1 computer and there are 4 techys then around 20 computers can be built in day. This chart is on the scale of hours.

The problem is, my tutor wants a larger gantt chart on a scale of days, and I'm unsure how I am going to fit this into a larger gantt chart on the scale of days?

Any help would be good, thanks.
 
When I was in uni, we used Microsoft Project for gannt charts

Was easy in that if I remember rightly, but I've never used Project since :p
 
I'm not quite sure I understand you either but perhaps asking your lecturer for some clarification might be a good plan.

Also, +1 for MS Project, you can download a 30-day trial and use that if it's a case of having to print the final results out. If it's an electronic hand in then you're stuck with excel from the looks of things.
 
Project is a brilliant product for a useless exercise. I hated doing Gantt charts at uni, until I realised the lecturers didnt really read them they just wanted to something Ganttish in the pages to show we have considered time management.

Best bet is to ask your tutor and explain the scales. Or make the task for each technician to build a fixed number of machines that will be measured in days.

Of course though its a bit of an odd project, assume you have 4 technician a more efficient way would be to have 2 building and 2 installing software or creating an image of an unattended install and build one, start imaging, build another one while thats going on.
 
Gantt charts are normally used for larger projects over longer durations. Perhaps your tutor is suggesting you choose another 'project' to model that has a longer timeframe?
E.g. to follow the 'build a pc' theme, maybe research, specify a system, get quotes from suppliers, get finance, order parts from various places, wait for everything to arrive, build it, etc.

I agree with this.... otherwise your just going to have to copy and paste the chart so you have three days which are replicated.
 
Well the duration is 60 days apparently, the tutor won't explain anything else.

I have done 3 charts, they are pretty simple.

gannttgfdgjd.jpg


What I need to do is get this into one chart, and it's on a daily scale of 60 days, basically the brief says we have 250 computers to upgrade and due to the times it takes to get one computer up and running I estimate 20 computers a day assuming they have 4 techys.

But I really cannot work out how to get this into one gantt chart.
 
Looks to me that you are trying to do it in too much detail. I would certainly have a few words with a PM that gave me a gantt chart broken down in to minutes...
 
I broke the chart down into minutes.

The reason being is we where told to make a gannt chart for the installation of the individual pc parts, now if the tutor thought this was too much detail though I thought hed tell me? I'm just really confused I hate these charts.

The problem is, if I do less detail, I can't think of the point of a gantt chart.

250 pc's
60 days

tasks:
install hardware
install software
user training
testing

Unless the way I should do it, is allow 30 days for PC hardware/software install, 20 for user trianing and 10 for testing, but then all I can see is 3 lines on a chart.
 
Looks to me that you are trying to do it in too much detail. I would certainly have a few words with a PM that gave me a gantt chart broken down in to minutes...

Depends entirely what your line of work is and what level of detail you're working to. Ours are broken down into minutes here (rail engineering) as every minute is critical... unfortunatley ^^
 
It is quite a small project so I wouldn't expect more than a few lines on a Gantt chart. Has the phase of identifying hardware and software already been done? Otherwise they would also be candidates for tasks.
 
The only way i can see it working is if you do all 250 PC's at once, so you spend X days fitting them all with HDD, then another couple of days doing Grafx....

Impractical in my oppinion but that is maybe what your assessor wants ?
 
We have to fit them all in one go, identifying software was done for us, we need to do audit sheets like but we are not needed to include that, all we need to include is hardware/software installation, training staff and testing, that's about it.
 
In that case it looks like a gantt chart with four lines. Hardware installation, software installation, training and testing. Show the dependancies and job done?
 
Back
Top Bottom