

Permabanned
- Joined
- 9 Aug 2008
- Posts
- 35,711
Maybe I should just do a clean install and go from there?
nah no need just remove the stuff you don't use. If there's no problems now don't touch it apart from some of the installed apps.
Maybe I should just do a clean install and go from there?
Just to confirm are you talking about the apps, or drivers?nah no need just remove the stuff you don't use. If there's no problems now don't touch it apart from some of the installed apps.
Thanks - yep I’ll go through this list and just bin them in that caseBitDefender Agent
BitDefender Internet Security
Core Temp 1.17.1
Driver Easy 5.7.3
Heaven Bencemark version 4.0
uTorrent Web
Web Companion
Windows PC Health Check
That's what I would remove, these are not touching the drivers (before you had the issue) I would have personally removed all the drivers, but you have appeared to have fixed that now.
BitDefender is just adding another layer to your system when there's protection built into windows 10/11 anyway so no real need to add a 3rd party. As long as you keep the definitions updated and also keep windows updated you should be alright.
The more you have installed the more stuff there's going to be running in the background. I used to use windows 10 LTSC version and there was literally 26 processors running at all times.
…does the drivers list look relatively normal? I see multiples of a lot of things but don’t know if that’s normal haBitDefender Agent
BitDefender Internet Security
Core Temp 1.17.1
Driver Easy 5.7.3
Heaven Bencemark version 4.0
uTorrent Web
Web Companion
Windows PC Health Check
That's what I would remove, these are not touching the drivers (before you had the issue) I would have personally removed all the drivers, but you have appeared to have fixed that now.
BitDefender is just adding another layer to your system when there's protection built into windows 10/11 anyway so no real need to add a 3rd party. As long as you keep the definitions updated and also keep windows updated you should be alright.
The more you have installed the more stuff there's going to be running in the background. I used to use windows 10 LTSC version and there was literally 26 processors running at all times.
…does the drivers list look relatively normal? I see multiples of a lot of things but don’t know if that’s normal ha
Thanks for the tip - I wont pretend to understand exactly what this program does, however I have just run it for about 10 mins and an error has been reported:I would try running something like LatencyMon to see if it points to a driver or program running at the background causing the issue.

 www.overclockers.co.uk
Holy crap 101024.50!Thanks for the tip - I wont pretend to understand exactly what this program does, however I have just run it for about 10 mins and an error has been reported:
latencymon — Postimages
postimg.cc
my PSU is:
Super Flower Leadex Gold 1600W Fully Modular 80 Plus Gold Power Supply - Bl
Order Super Flower Leadex Gold 1600W Fully Modular 80 Plus Gold Power Supply - Bl now online and benefit from fast delivery.
I dont believe I am throttling, wouldnt know how....how would one check and rule that out?
 That the highest latency ever I never seen it before.
...when trying to install the vga card driver from gigabyte control center, first time it went through installation process, then said there was an error installing (no reason), and second time I got the BSOD with stop code of UNEXPECTED KERNEL TRAP
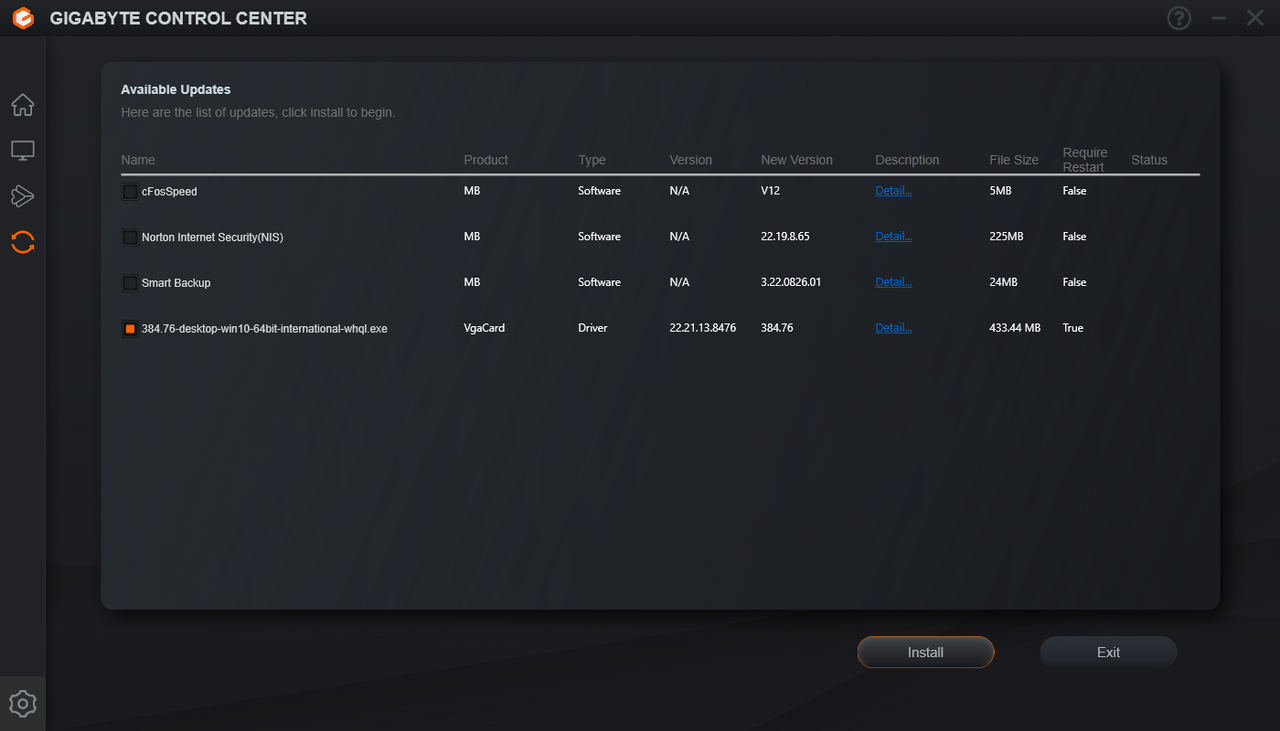
gcc error 01 — Postimages
Thanks for taking a look.
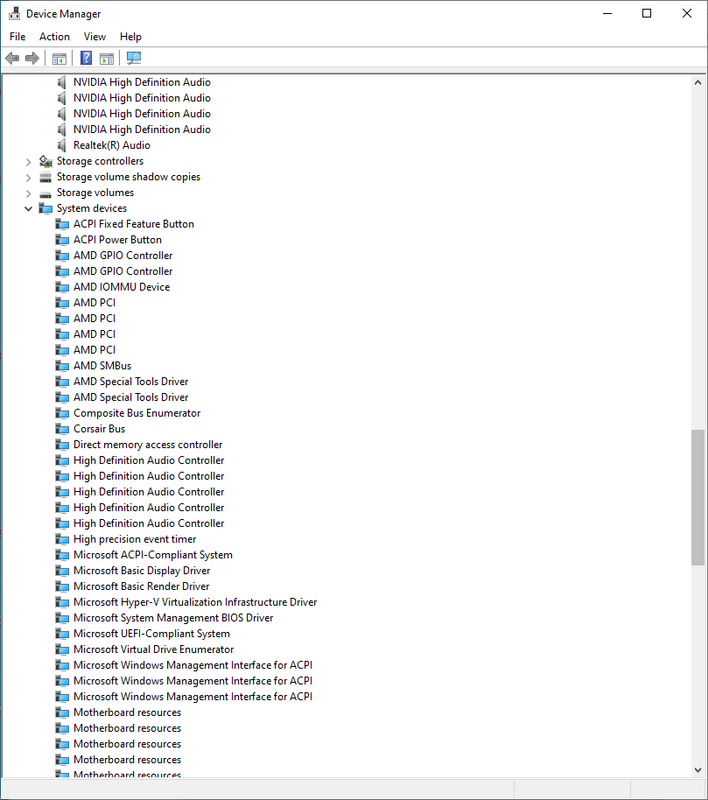
here is a list of the drivers (multiple screengrabs, sorry if this isnt the best way to share this stuff)
drivers:
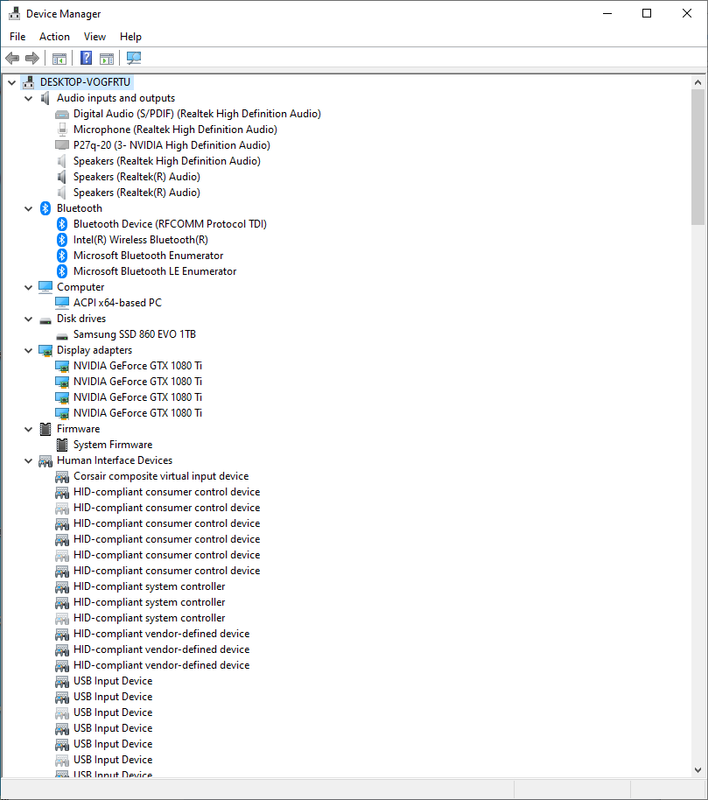
Album — Postimages
Thanks for the tip - I wont pretend to understand exactly what this program does, however I have just run it for about 10 mins and an error has been reported:
latencymon — Postimages
my PSU is:
Super Flower Leadex Gold 1600W Fully Modular 80 Plus Gold Power Supply - Bl
Order Super Flower Leadex Gold 1600W Fully Modular 80 Plus Gold Power Supply - Bl now online and benefit from fast delivery.
I dont believe I am throttling, wouldnt know how....how would one check and rule that out?
Hey,Holy crap 101024.50!
Can you run latencymon again for 10 mins then click stop monitor and click on Stats tab then click Edit on menu and select Copy report text to clipboard. Paste your report here so I wonder what driver or processes caused the highest latency ever way off the chart.

AMD Chipset Software
GBT_MB_Update 22.09.20.01
GBT_RGB_Sync_Control 22.09.26.01
GBT_rgbMotherboard_UC 22.11.03.01
GBT_VGA 22.11.25.03
GIGABYTE Control Center 22.11.03.01
GIGABYTE Storage Libary
Intel(R) C++ Redistributables on Intel(R) 64
Intel(R) Network Connections 26.2.0.1
LenovoDisaplayControlCenterService
Microsoft Update Health Tools
MSI Afterburner 4.6.3
Private Internet Access
Realtek Audio Driver
UpLink23 2.3
These are the drivers and there's some software I missed in that list from before, uninstall these one by one and after they have all been uninstalled do a reboot. Note that the network drivers will be uninstalled so make sure you have access to another system just in case the system doesn't install default drivers for these after a reboot.
There's a lot of unrequired stuff in this list of items.
Wow I guess I found what caused it.Hey,
Here is the 10min report....it reports high level again:
_________________________________________________________________________________________________________
CONCLUSION
_________________________________________________________________________________________________________
Your system appears to be having trouble handling real-time audio and other tasks. You are likely to experience buffer underruns appearing as drop outs, clicks or pops. One or more DPC routines that belong to a driver running in your system appear to be executing for too long. One problem may be related to power management, disable CPU throttling settings in Control Panel and BIOS setup. Check for BIOS updates.
LatencyMon has been analyzing your system for 0:14:54 (h:mm:ss) on all processors.
_________________________________________________________________________________________________________
SYSTEM INFORMATION
_________________________________________________________________________________________________________
Computer name: DESKTOP-VOGFRTU
OS version: Windows 10, 10.0, version 2009, build: 19044 (x64)
Hardware: X399 AORUS XTREME, Gigabyte Technology Co., Ltd.
BIOS: F4
CPU: AuthenticAMD AMD Ryzen Threadripper 1900X 8-Core Processor
Logical processors: 16
Processor groups: 1
Processor group size: 16
RAM: 98198 MB total
_________________________________________________________________________________________________________
CPU SPEED
_________________________________________________________________________________________________________
Reported CPU speed (WMI): 380 MHz
Reported CPU speed (registry): 3793 MHz
Note: reported execution times may be calculated based on a fixed reported CPU speed. Disable variable speed settings like Intel Speed Step and AMD Cool N Quiet in the BIOS setup for more accurate results.
_________________________________________________________________________________________________________
MEASURED INTERRUPT TO USER PROCESS LATENCIES
_________________________________________________________________________________________________________
The interrupt to process latency reflects the measured interval that a usermode process needed to respond to a hardware request from the moment the interrupt service routine started execution. This includes the scheduling and execution of a DPC routine, the signaling of an event and the waking up of a usermode thread from an idle wait state in response to that event.
Highest measured interrupt to process latency (µs): 100605.40
Average measured interrupt to process latency (µs): 6.519253
Highest measured interrupt to DPC latency (µs): 100599.20
Average measured interrupt to DPC latency (µs): 3.394019
_________________________________________________________________________________________________________
REPORTED ISRs
_________________________________________________________________________________________________________
Interrupt service routines are routines installed by the OS and device drivers that execute in response to a hardware interrupt signal.
Highest ISR routine execution time (µs): 544.753493
Driver with highest ISR routine execution time: dxgkrnl.sys - DirectX Graphics Kernel, Microsoft Corporation
Highest reported total ISR routine time (%): 0.048933
Driver with highest ISR total time: dxgkrnl.sys - DirectX Graphics Kernel, Microsoft Corporation
Total time spent in ISRs (%) 0.049660
ISR count (execution time <250 µs): 344234
ISR count (execution time 250-500 µs): 0
ISR count (execution time 500-1000 µs): 95
ISR count (execution time 1000-2000 µs): 0
ISR count (execution time 2000-4000 µs): 0
ISR count (execution time >=4000 µs): 0
_________________________________________________________________________________________________________
REPORTED DPCs
_________________________________________________________________________________________________________
DPC routines are part of the interrupt servicing dispatch mechanism and disable the possibility for a process to utilize the CPU while it is interrupted until the DPC has finished execution.
Highest DPC routine execution time (µs): 100973.493804
Driver with highest DPC routine execution time: storport.sys - Microsoft Storage Port Driver, Microsoft Corporation
Highest reported total DPC routine time (%): 0.022799
Driver with highest DPC total execution time: dxgkrnl.sys - DirectX Graphics Kernel, Microsoft Corporation
Total time spent in DPCs (%) 0.079334
DPC count (execution time <250 µs): 1140724
DPC count (execution time 250-500 µs): 0
DPC count (execution time 500-10000 µs): 492
DPC count (execution time 1000-2000 µs): 3
DPC count (execution time 2000-4000 µs): 0
DPC count (execution time >=4000 µs): 2
_________________________________________________________________________________________________________
REPORTED HARD PAGEFAULTS
_________________________________________________________________________________________________________
Hard pagefaults are events that get triggered by making use of virtual memory that is not resident in RAM but backed by a memory mapped file on disk. The process of resolving the hard pagefault requires reading in the memory from disk while the process is interrupted and blocked from execution.
NOTE: some processes were hit by hard pagefaults. If these were programs producing audio, they are likely to interrupt the audio stream resulting in dropouts, clicks and pops. Check the Processes tab to see which programs were hit.
Process with highest pagefault count: dropbox.exe
Total number of hard pagefaults 110940
Hard pagefault count of hardest hit process: 30402
Number of processes hit: 106
_________________________________________________________________________________________________________
PER CPU DATA
_________________________________________________________________________________________________________
CPU 0 Interrupt cycle time (s): 62.566940
CPU 0 ISR highest execution time (µs): 397.301872
CPU 0 ISR total execution time (s): 4.942907
CPU 0 ISR count: 224646
CPU 0 DPC highest execution time (µs): 100973.493804
CPU 0 DPC total execution time (s): 7.285038
CPU 0 DPC count: 685450
_________________________________________________________________________________________________________
CPU 1 Interrupt cycle time (s): 48.530497
CPU 1 ISR highest execution time (µs): 544.753493
CPU 1 ISR total execution time (s): 1.371065
CPU 1 ISR count: 65124
CPU 1 DPC highest execution time (µs): 1017.544424
CPU 1 DPC total execution time (s): 1.267132
CPU 1 DPC count: 132075
_________________________________________________________________________________________________________
CPU 2 Interrupt cycle time (s): 25.24280
CPU 2 ISR highest execution time (µs): 323.395729
CPU 2 ISR total execution time (s): 0.767433
CPU 2 ISR count: 37428
CPU 2 DPC highest execution time (µs): 411.598207
CPU 2 DPC total execution time (s): 0.729732
CPU 2 DPC count: 105278
_________________________________________________________________________________________________________
CPU 3 Interrupt cycle time (s): 34.270572
CPU 3 ISR highest execution time (µs): 147.281308
CPU 3 ISR total execution time (s): 0.014001
CPU 3 ISR count: 994
CPU 3 DPC highest execution time (µs): 258.586343
CPU 3 DPC total execution time (s): 0.08570
CPU 3 DPC count: 8230
_________________________________________________________________________________________________________
CPU 4 Interrupt cycle time (s): 27.810598
CPU 4 ISR highest execution time (µs): 19.205378
CPU 4 ISR total execution time (s): 0.000532
CPU 4 ISR count: 111
CPU 4 DPC highest execution time (µs): 377.244925
CPU 4 DPC total execution time (s): 0.293731
CPU 4 DPC count: 34378
_________________________________________________________________________________________________________
CPU 5 Interrupt cycle time (s): 35.717513
CPU 5 ISR highest execution time (µs): 9.016610
CPU 5 ISR total execution time (s): 0.000050
CPU 5 ISR count: 7
CPU 5 DPC highest execution time (µs): 297.477986
CPU 5 DPC total execution time (s): 0.076372
CPU 5 DPC count: 10165
_________________________________________________________________________________________________________
CPU 6 Interrupt cycle time (s): 22.368438
CPU 6 ISR highest execution time (µs): 0.0
CPU 6 ISR total execution time (s): 0.0
CPU 6 ISR count: 0
CPU 6 DPC highest execution time (µs): 298.079093
CPU 6 DPC total execution time (s): 0.175267
CPU 6 DPC count: 21923
_________________________________________________________________________________________________________
CPU 7 Interrupt cycle time (s): 30.919703
CPU 7 ISR highest execution time (µs): 0.0
CPU 7 ISR total execution time (s): 0.0
CPU 7 ISR count: 0
CPU 7 DPC highest execution time (µs): 292.007909
CPU 7 DPC total execution time (s): 0.048891
CPU 7 DPC count: 6129
_________________________________________________________________________________________________________
CPU 8 Interrupt cycle time (s): 7.893570
CPU 8 ISR highest execution time (µs): 0.0
CPU 8 ISR total execution time (s): 0.0
CPU 8 ISR count: 0
CPU 8 DPC highest execution time (µs): 253.787503
CPU 8 DPC total execution time (s): 0.137890
CPU 8 DPC count: 15498
_________________________________________________________________________________________________________
CPU 9 Interrupt cycle time (s): 7.706616
CPU 9 ISR highest execution time (µs): 0.0
CPU 9 ISR total execution time (s): 0.0
CPU 9 ISR count: 0
CPU 9 DPC highest execution time (µs): 519.166359
CPU 9 DPC total execution time (s): 0.176003
CPU 9 DPC count: 21058
_________________________________________________________________________________________________________
CPU 10 Interrupt cycle time (s): 9.031537
CPU 10 ISR highest execution time (µs): 0.0
CPU 10 ISR total execution time (s): 0.0
CPU 10 ISR count: 0
CPU 10 DPC highest execution time (µs): 304.210388
CPU 10 DPC total execution time (s): 0.216764
CPU 10 DPC count: 24149
_________________________________________________________________________________________________________
CPU 11 Interrupt cycle time (s): 8.677123
CPU 11 ISR highest execution time (µs): 0.0
CPU 11 ISR total execution time (s): 0.0
CPU 11 ISR count: 0
CPU 11 DPC highest execution time (µs): 279.564988
CPU 11 DPC total execution time (s): 0.074355
CPU 11 DPC count: 7595
_________________________________________________________________________________________________________
CPU 12 Interrupt cycle time (s): 6.152134
CPU 12 ISR highest execution time (µs): 36.346955
CPU 12 ISR total execution time (s): 0.003401
CPU 12 ISR count: 3435
CPU 12 DPC highest execution time (µs): 417.018191
CPU 12 DPC total execution time (s): 0.248469
CPU 12 DPC count: 24123
_________________________________________________________________________________________________________
CPU 13 Interrupt cycle time (s): 5.492920
CPU 13 ISR highest execution time (µs): 9.226997
CPU 13 ISR total execution time (s): 0.000407
CPU 13 ISR count: 389
CPU 13 DPC highest execution time (µs): 229.572897
CPU 13 DPC total execution time (s): 0.038761
CPU 13 DPC count: 3908
_________________________________________________________________________________________________________
CPU 14 Interrupt cycle time (s): 43.658904
CPU 14 ISR highest execution time (µs): 119.900870
CPU 14 ISR total execution time (s): 0.002189
CPU 14 ISR count: 2104
CPU 14 DPC highest execution time (µs): 289.663591
CPU 14 DPC total execution time (s): 0.283504
CPU 14 DPC count: 24681
_________________________________________________________________________________________________________
CPU 15 Interrupt cycle time (s): 44.797613
CPU 15 ISR highest execution time (µs): 132.313736
CPU 15 ISR total execution time (s): 0.008868
CPU 15 ISR count: 10091
CPU 15 DPC highest execution time (µs): 361.165305
CPU 15 DPC total execution time (s): 0.222215
CPU 15 DPC count: 16581
_________________________________________________________________________________________________________
As for those drivers you mentioned (Microsoft Basic Display Driver and Microsoft Basic Render Driver) - I just checked my driver list and they are not on the list anymore, is that a weird thing to happen?
Here is a link to what I see from the blue screen view app you recommended
blue screen view — Postimages
"That the highest latency ever I never seen it before." - I take that reaction as a badge of honour, hope you have put me on the right track to fixing this once and for all.

Maybe I should just reinstall windows?
Oh dear....dropbox is now gone.
I ran latencymon again, still high though
_________________________________________________________________________________________________________
CONCLUSION
_________________________________________________________________________________________________________
Your system appears to be having trouble handling real-time audio and other tasks. You are likely to experience buffer underruns appearing as drop outs, clicks or pops. One or more DPC routines that belong to a driver running in your system appear to be executing for too long. One problem may be related to power management, disable CPU throttling settings in Control Panel and BIOS setup. Check for BIOS updates.
LatencyMon has been analyzing your system for 0:15:40 (h:mm:ss) on all processors.
_________________________________________________________________________________________________________
SYSTEM INFORMATION
_________________________________________________________________________________________________________
Computer name: DESKTOP-VOGFRTU
OS version: Windows 10, 10.0, version 2009, build: 19044 (x64)
Hardware: X399 AORUS XTREME, Gigabyte Technology Co., Ltd.
BIOS: F4
CPU: AuthenticAMD AMD Ryzen Threadripper 1900X 8-Core Processor
Logical processors: 16
Processor groups: 1
Processor group size: 16
RAM: 98198 MB total
_________________________________________________________________________________________________________
CPU SPEED
_________________________________________________________________________________________________________
Reported CPU speed (WMI): 380 MHz
Reported CPU speed (registry): 3793 MHz
Note: reported execution times may be calculated based on a fixed reported CPU speed. Disable variable speed settings like Intel Speed Step and AMD Cool N Quiet in the BIOS setup for more accurate results.
_________________________________________________________________________________________________________
MEASURED INTERRUPT TO USER PROCESS LATENCIES
_________________________________________________________________________________________________________
The interrupt to process latency reflects the measured interval that a usermode process needed to respond to a hardware request from the moment the interrupt service routine started execution. This includes the scheduling and execution of a DPC routine, the signaling of an event and the waking up of a usermode thread from an idle wait state in response to that event.
Highest measured interrupt to process latency (µs): 100781.50
Average measured interrupt to process latency (µs): 9.909498
Highest measured interrupt to DPC latency (µs): 100762.50
Average measured interrupt to DPC latency (µs): 6.795128
_________________________________________________________________________________________________________
REPORTED ISRs
_________________________________________________________________________________________________________
Interrupt service routines are routines installed by the OS and device drivers that execute in response to a hardware interrupt signal.
Highest ISR routine execution time (µs): 280.256262
Driver with highest ISR routine execution time: dxgkrnl.sys - DirectX Graphics Kernel, Microsoft Corporation
Highest reported total ISR routine time (%): 0.023403
Driver with highest ISR total time: dxgkrnl.sys - DirectX Graphics Kernel, Microsoft Corporation
Total time spent in ISRs (%) 0.023599
ISR count (execution time <250 µs): 164560
ISR count (execution time 250-500 µs): 0
ISR count (execution time 500-1000 µs): 5
ISR count (execution time 1000-2000 µs): 0
ISR count (execution time 2000-4000 µs): 0
ISR count (execution time >=4000 µs): 0
_________________________________________________________________________________________________________
REPORTED DPCs
_________________________________________________________________________________________________________
DPC routines are part of the interrupt servicing dispatch mechanism and disable the possibility for a process to utilize the CPU while it is interrupted until the DPC has finished execution.
Highest DPC routine execution time (µs): 100906.350119
Driver with highest DPC routine execution time: storport.sys - Microsoft Storage Port Driver, Microsoft Corporation
Highest reported total DPC routine time (%): 0.012882
Driver with highest DPC total execution time: dxgkrnl.sys - DirectX Graphics Kernel, Microsoft Corporation
Total time spent in DPCs (%) 0.035562
DPC count (execution time <250 µs): 347920
DPC count (execution time 250-500 µs): 0
DPC count (execution time 500-10000 µs): 505
DPC count (execution time 1000-2000 µs): 0
DPC count (execution time 2000-4000 µs): 0
DPC count (execution time >=4000 µs): 1
_________________________________________________________________________________________________________
REPORTED HARD PAGEFAULTS
_________________________________________________________________________________________________________
Hard pagefaults are events that get triggered by making use of virtual memory that is not resident in RAM but backed by a memory mapped file on disk. The process of resolving the hard pagefault requires reading in the memory from disk while the process is interrupted and blocked from execution.
NOTE: some processes were hit by hard pagefaults. If these were programs producing audio, they are likely to interrupt the audio stream resulting in dropouts, clicks and pops. Check the Processes tab to see which programs were hit.
Process with highest pagefault count: bdservicehost.exe
Total number of hard pagefaults 2128
Hard pagefault count of hardest hit process: 814
Number of processes hit: 16
_________________________________________________________________________________________________________
PER CPU DATA
_________________________________________________________________________________________________________
CPU 0 Interrupt cycle time (s): 19.900004
CPU 0 ISR highest execution time (µs): 280.256262
CPU 0 ISR total execution time (s): 3.543557
CPU 0 ISR count: 163335
CPU 0 DPC highest execution time (µs): 100906.350119
CPU 0 DPC total execution time (s): 4.190167
CPU 0 DPC count: 316360
_________________________________________________________________________________________________________
CPU 1 Interrupt cycle time (s): 6.744465
CPU 1 ISR highest execution time (µs): 66.252043
CPU 1 ISR total execution time (s): 0.005109
CPU 1 ISR count: 256
CPU 1 DPC highest execution time (µs): 254.889533
CPU 1 DPC total execution time (s): 0.008940
CPU 1 DPC count: 1060
_________________________________________________________________________________________________________
CPU 2 Interrupt cycle time (s): 4.984159
CPU 2 ISR highest execution time (µs): 0.0
CPU 2 ISR total execution time (s): 0.0
CPU 2 ISR count: 0
CPU 2 DPC highest execution time (µs): 219.514369
CPU 2 DPC total execution time (s): 0.007460
CPU 2 DPC count: 1414
_________________________________________________________________________________________________________
CPU 3 Interrupt cycle time (s): 4.237717
CPU 3 ISR highest execution time (µs): 0.0
CPU 3 ISR total execution time (s): 0.0
CPU 3 ISR count: 0
CPU 3 DPC highest execution time (µs): 218.161877
CPU 3 DPC total execution time (s): 0.002801
CPU 3 DPC count: 418
_________________________________________________________________________________________________________
CPU 4 Interrupt cycle time (s): 3.422681
CPU 4 ISR highest execution time (µs): 0.0
CPU 4 ISR total execution time (s): 0.0
CPU 4 ISR count: 0
CPU 4 DPC highest execution time (µs): 211.920380
CPU 4 DPC total execution time (s): 0.002814
CPU 4 DPC count: 526
_________________________________________________________________________________________________________
CPU 5 Interrupt cycle time (s): 3.278304
CPU 5 ISR highest execution time (µs): 0.0
CPU 5 ISR total execution time (s): 0.0
CPU 5 ISR count: 0
CPU 5 DPC highest execution time (µs): 136.190878
CPU 5 DPC total execution time (s): 0.001165
CPU 5 DPC count: 233
_________________________________________________________________________________________________________
CPU 6 Interrupt cycle time (s): 3.33110
CPU 6 ISR highest execution time (µs): 0.0
CPU 6 ISR total execution time (s): 0.0
CPU 6 ISR count: 0
CPU 6 DPC highest execution time (µs): 146.059056
CPU 6 DPC total execution time (s): 0.002711
CPU 6 DPC count: 516
_________________________________________________________________________________________________________
CPU 7 Interrupt cycle time (s): 3.451390
CPU 7 ISR highest execution time (µs): 0.0
CPU 7 ISR total execution time (s): 0.0
CPU 7 ISR count: 0
CPU 7 DPC highest execution time (µs): 245.792776
CPU 7 DPC total execution time (s): 0.002103
CPU 7 DPC count: 267
_________________________________________________________________________________________________________
CPU 8 Interrupt cycle time (s): 2.835352
CPU 8 ISR highest execution time (µs): 0.0
CPU 8 ISR total execution time (s): 0.0
CPU 8 ISR count: 0
CPU 8 DPC highest execution time (µs): 275.577643
CPU 8 DPC total execution time (s): 0.013393
CPU 8 DPC count: 795
_________________________________________________________________________________________________________
CPU 9 Interrupt cycle time (s): 2.948323
CPU 9 ISR highest execution time (µs): 0.0
CPU 9 ISR total execution time (s): 0.0
CPU 9 ISR count: 0
CPU 9 DPC highest execution time (µs): 317.023992
CPU 9 DPC total execution time (s): 0.094340
CPU 9 DPC count: 2104
_________________________________________________________________________________________________________
CPU 10 Interrupt cycle time (s): 4.298029
CPU 10 ISR highest execution time (µs): 0.0
CPU 10 ISR total execution time (s): 0.0
CPU 10 ISR count: 0
CPU 10 DPC highest execution time (µs): 336.219351
CPU 10 DPC total execution time (s): 0.170516
CPU 10 DPC count: 4996
_________________________________________________________________________________________________________
CPU 11 Interrupt cycle time (s): 4.324570
CPU 11 ISR highest execution time (µs): 0.0
CPU 11 ISR total execution time (s): 0.0
CPU 11 ISR count: 0
CPU 11 DPC highest execution time (µs): 382.825204
CPU 11 DPC total execution time (s): 0.462130
CPU 11 DPC count: 10133
_________________________________________________________________________________________________________
CPU 12 Interrupt cycle time (s): 2.049521
CPU 12 ISR highest execution time (µs): 2.805167
CPU 12 ISR total execution time (s): 0.000162
CPU 12 ISR count: 136
CPU 12 DPC highest execution time (µs): 370.362246
CPU 12 DPC total execution time (s): 0.080837
CPU 12 DPC count: 2340
_________________________________________________________________________________________________________
CPU 13 Interrupt cycle time (s): 1.863369
CPU 13 ISR highest execution time (µs): 1.222252
CPU 13 ISR total execution time (s): 0.000004
CPU 13 ISR count: 4
CPU 13 DPC highest execution time (µs): 329.847614
CPU 13 DPC total execution time (s): 0.004850
CPU 13 DPC count: 226
_________________________________________________________________________________________________________
CPU 14 Interrupt cycle time (s): 6.947509
CPU 14 ISR highest execution time (µs): 14.857369
CPU 14 ISR total execution time (s): 0.000092
CPU 14 ISR count: 90
CPU 14 DPC highest execution time (µs): 296.886897
CPU 14 DPC total execution time (s): 0.084946
CPU 14 DPC count: 2537
_________________________________________________________________________________________________________
CPU 15 Interrupt cycle time (s): 7.945235
CPU 15 ISR highest execution time (µs): 3.185869
CPU 15 ISR total execution time (s): 0.000648
CPU 15 ISR count: 744
CPU 15 DPC highest execution time (µs): 312.345373
CPU 15 DPC total execution time (s): 0.219780
CPU 15 DPC count: 4501
_________________________________________________________________________________________________________
Maybe I should just reinstall windows?