I have followed your steps re: what drivers to uninstall.
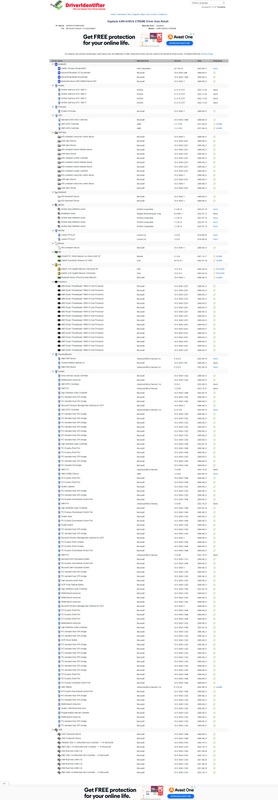
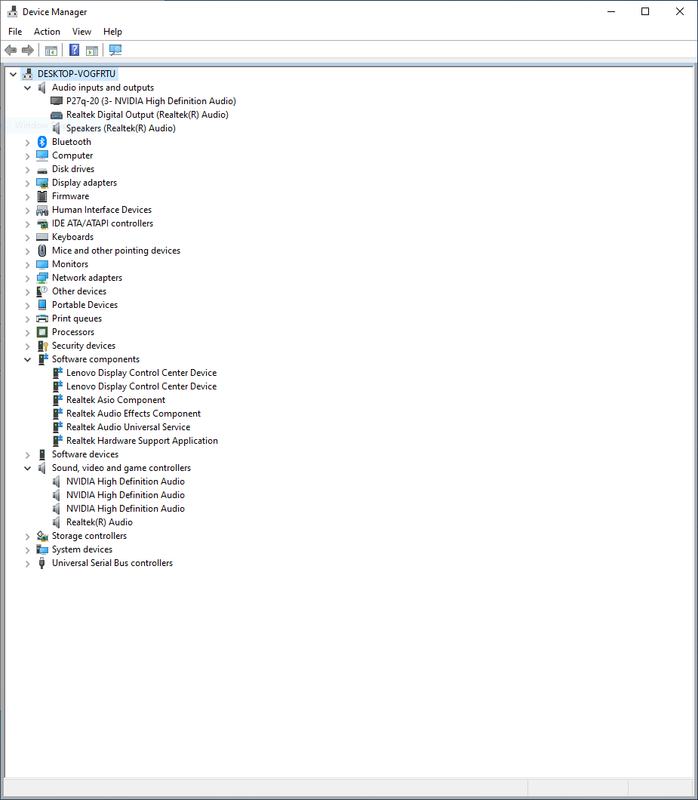
I restarted the pc and checked the driver list again, they reappeared like this:

postimg.cc
I juts run latencymon again for 5 mins looks like this now, better right?
_________________________________________________________________________________________________________
CONCLUSION
_________________________________________________________________________________________________________
Your system appears to be suitable for handling real-time audio and other tasks without dropouts.
LatencyMon has been analyzing your system for 0:05:52 (h:mm:ss) on all processors.
_________________________________________________________________________________________________________
SYSTEM INFORMATION
_________________________________________________________________________________________________________
Computer name: DESKTOP-VOGFRTU
OS version: Windows 10, 10.0, version 2009, build: 19044 (x64)
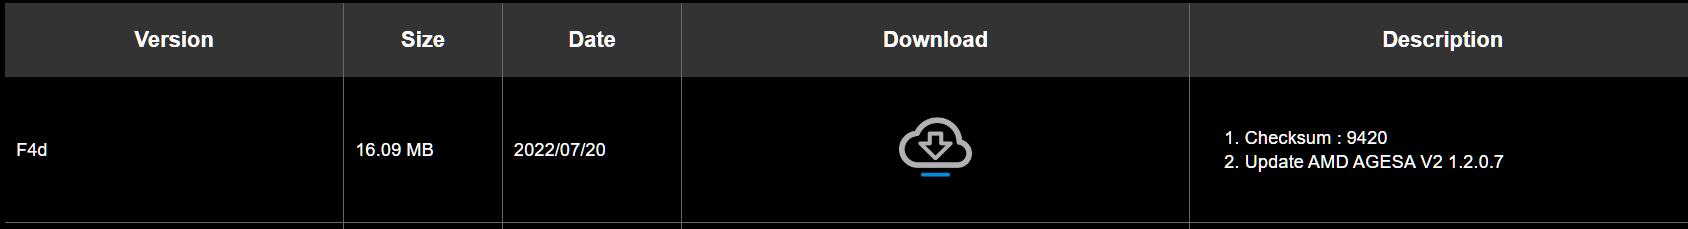
Hardware: X399 AORUS XTREME, Gigabyte Technology Co., Ltd.
BIOS: F4
CPU: AuthenticAMD AMD Ryzen Threadripper 1900X 8-Core Processor
Logical processors: 16
Processor groups: 1
Processor group size: 16
RAM: 98198 MB total
_________________________________________________________________________________________________________
CPU SPEED
_________________________________________________________________________________________________________
Reported CPU speed (WMI): 380 MHz
Reported CPU speed (registry): 3793 MHz
Note: reported execution times may be calculated based on a fixed reported CPU speed. Disable variable speed settings like Intel Speed Step and AMD Cool N Quiet in the BIOS setup for more accurate results.
_________________________________________________________________________________________________________
MEASURED INTERRUPT TO USER PROCESS LATENCIES
_________________________________________________________________________________________________________
The interrupt to process latency reflects the measured interval that a usermode process needed to respond to a hardware request from the moment the interrupt service routine started execution. This includes the scheduling and execution of a DPC routine, the signaling of an event and the waking up of a usermode thread from an idle wait state in response to that event.
Highest measured interrupt to process latency (µs): 406.80
Average measured interrupt to process latency (µs): 6.012295
Highest measured interrupt to DPC latency (µs): 401.90
Average measured interrupt to DPC latency (µs): 2.922361
_________________________________________________________________________________________________________
REPORTED ISRs
_________________________________________________________________________________________________________
Interrupt service routines are routines installed by the OS and device drivers that execute in response to a hardware interrupt signal.
Highest ISR routine execution time (µs): 332.592671
Driver with highest ISR routine execution time: dxgkrnl.sys - DirectX Graphics Kernel, Microsoft Corporation
Highest reported total ISR routine time (%): 0.021755
Driver with highest ISR total time: dxgkrnl.sys - DirectX Graphics Kernel, Microsoft Corporation
Total time spent in ISRs (%) 0.022291
ISR count (execution time <250 µs): 57198
ISR count (execution time 250-500 µs): 0
ISR count (execution time 500-1000 µs): 27
ISR count (execution time 1000-2000 µs): 0
ISR count (execution time 2000-4000 µs): 0
ISR count (execution time >=4000 µs): 0
_________________________________________________________________________________________________________
REPORTED DPCs
_________________________________________________________________________________________________________
DPC routines are part of the interrupt servicing dispatch mechanism and disable the possibility for a process to utilize the CPU while it is interrupted until the DPC has finished execution.
Highest DPC routine execution time (µs): 610.224097
Driver with highest DPC routine execution time: nvlddmkm.sys - NVIDIA Windows Kernel Mode Driver, Version 527.37 , NVIDIA Corporation
Highest reported total DPC routine time (%): 0.011039
Driver with highest DPC total execution time: nvlddmkm.sys - NVIDIA Windows Kernel Mode Driver, Version 527.37 , NVIDIA Corporation
Total time spent in DPCs (%) 0.039515
DPC count (execution time <250 µs): 201885
DPC count (execution time 250-500 µs): 0
DPC count (execution time 500-10000 µs): 137
DPC count (execution time 1000-2000 µs): 0
DPC count (execution time 2000-4000 µs): 0
DPC count (execution time >=4000 µs): 0
_________________________________________________________________________________________________________
REPORTED HARD PAGEFAULTS
_________________________________________________________________________________________________________
Hard pagefaults are events that get triggered by making use of virtual memory that is not resident in RAM but backed by a memory mapped file on disk. The process of resolving the hard pagefault requires reading in the memory from disk while the process is interrupted and blocked from execution.
NOTE: some processes were hit by hard pagefaults. If these were programs producing audio, they are likely to interrupt the audio stream resulting in dropouts, clicks and pops. Check the Processes tab to see which programs were hit.
Process with highest pagefault count: bdservicehost.exe
Total number of hard pagefaults 3525
Hard pagefault count of hardest hit process: 1968
Number of processes hit: 24
_________________________________________________________________________________________________________
PER CPU DATA
_________________________________________________________________________________________________________
CPU 0 Interrupt cycle time (s): 24.350804
CPU 0 ISR highest execution time (µs): 332.592671
CPU 0 ISR total execution time (s): 1.187539
CPU 0 ISR count: 50820
CPU 0 DPC highest execution time (µs): 610.224097
CPU 0 DPC total execution time (s): 1.930645
CPU 0 DPC count: 176767
_________________________________________________________________________________________________________
CPU 1 Interrupt cycle time (s): 21.024699
CPU 1 ISR highest execution time (µs): 288.140786
CPU 1 ISR total execution time (s): 0.065105
CPU 1 ISR count: 2939
CPU 1 DPC highest execution time (µs): 461.870815
CPU 1 DPC total execution time (s): 0.099673
CPU 1 DPC count: 4979
_________________________________________________________________________________________________________
CPU 2 Interrupt cycle time (s): 7.843361
CPU 2 ISR highest execution time (µs): 71.732138
CPU 2 ISR total execution time (s): 0.002159
CPU 2 ISR count: 145
CPU 2 DPC highest execution time (µs): 244.34010
CPU 2 DPC total execution time (s): 0.020370
CPU 2 DPC count: 2584
_________________________________________________________________________________________________________
CPU 3 Interrupt cycle time (s): 14.606682
CPU 3 ISR highest execution time (µs): 0.0
CPU 3 ISR total execution time (s): 0.0
CPU 3 ISR count: 0
CPU 3 DPC highest execution time (µs): 230.674927
CPU 3 DPC total execution time (s): 0.002286
CPU 3 DPC count: 420
_________________________________________________________________________________________________________
CPU 4 Interrupt cycle time (s): 10.095396
CPU 4 ISR highest execution time (µs): 0.0
CPU 4 ISR total execution time (s): 0.0
CPU 4 ISR count: 0
CPU 4 DPC highest execution time (µs): 334.235697
CPU 4 DPC total execution time (s): 0.081514
CPU 4 DPC count: 9108
_________________________________________________________________________________________________________
CPU 5 Interrupt cycle time (s): 14.236693
CPU 5 ISR highest execution time (µs): 0.0
CPU 5 ISR total execution time (s): 0.0
CPU 5 ISR count: 0
CPU 5 DPC highest execution time (µs): 166.757184
CPU 5 DPC total execution time (s): 0.002030
CPU 5 DPC count: 315
_________________________________________________________________________________________________________
CPU 6 Interrupt cycle time (s): 8.325229
CPU 6 ISR highest execution time (µs): 0.0
CPU 6 ISR total execution time (s): 0.0
CPU 6 ISR count: 0
CPU 6 DPC highest execution time (µs): 231.927234
CPU 6 DPC total execution time (s): 0.008896
CPU 6 DPC count: 1151
_________________________________________________________________________________________________________
CPU 7 Interrupt cycle time (s): 11.695981
CPU 7 ISR highest execution time (µs): 0.0
CPU 7 ISR total execution time (s): 0.0
CPU 7 ISR count: 0
CPU 7 DPC highest execution time (µs): 172.217242
CPU 7 DPC total execution time (s): 0.002282
CPU 7 DPC count: 334
_________________________________________________________________________________________________________
CPU 8 Interrupt cycle time (s): 2.794396
CPU 8 ISR highest execution time (µs): 0.0
CPU 8 ISR total execution time (s): 0.0
CPU 8 ISR count: 0
CPU 8 DPC highest execution time (µs): 263.685737
CPU 8 DPC total execution time (s): 0.003923
CPU 8 DPC count: 336
_________________________________________________________________________________________________________
CPU 9 Interrupt cycle time (s): 2.745673
CPU 9 ISR highest execution time (µs): 0.0
CPU 9 ISR total execution time (s): 0.0
CPU 9 ISR count: 0
CPU 9 DPC highest execution time (µs): 168.630635
CPU 9 DPC total execution time (s): 0.017004
CPU 9 DPC count: 2202
_________________________________________________________________________________________________________
CPU 10 Interrupt cycle time (s): 2.845162
CPU 10 ISR highest execution time (µs): 0.0
CPU 10 ISR total execution time (s): 0.0
CPU 10 ISR count: 0
CPU 10 DPC highest execution time (µs): 236.605853
CPU 10 DPC total execution time (s): 0.013391
CPU 10 DPC count: 1280
_________________________________________________________________________________________________________
CPU 11 Interrupt cycle time (s): 2.731053
CPU 11 ISR highest execution time (µs): 0.0
CPU 11 ISR total execution time (s): 0.0
CPU 11 ISR count: 0
CPU 11 DPC highest execution time (µs): 154.765094
CPU 11 DPC total execution time (s): 0.000947
CPU 11 DPC count: 104
_________________________________________________________________________________________________________
CPU 12 Interrupt cycle time (s): 1.907033
CPU 12 ISR highest execution time (µs): 3.215924
CPU 12 ISR total execution time (s): 0.000359
CPU 12 ISR count: 392
CPU 12 DPC highest execution time (µs): 183.297654
CPU 12 DPC total execution time (s): 0.004664
CPU 12 DPC count: 455
_________________________________________________________________________________________________________
CPU 13 Interrupt cycle time (s): 1.887099
CPU 13 ISR highest execution time (µs): 2.454521
CPU 13 ISR total execution time (s): 0.000018
CPU 13 ISR count: 17
CPU 13 DPC highest execution time (µs): 38.400738
CPU 13 DPC total execution time (s): 0.000801
CPU 13 DPC count: 71
_________________________________________________________________________________________________________
CPU 14 Interrupt cycle time (s): 20.469777
CPU 14 ISR highest execution time (µs): 3.245979
CPU 14 ISR total execution time (s): 0.000344
CPU 14 ISR count: 415
CPU 14 DPC highest execution time (µs): 302.377010
CPU 14 DPC total execution time (s): 0.005279
CPU 14 DPC count: 416
_________________________________________________________________________________________________________
CPU 15 Interrupt cycle time (s): 20.951553
CPU 15 ISR highest execution time (µs): 22.491432
CPU 15 ISR total execution time (s): 0.001933
CPU 15 ISR count: 2497
CPU 15 DPC highest execution time (µs): 296.476140
CPU 15 DPC total execution time (s): 0.035336
CPU 15 DPC count: 1500
_________________________________________________________________________________________________________
should I still install that new realtek driver as you mentioned?


")