National insurance cut

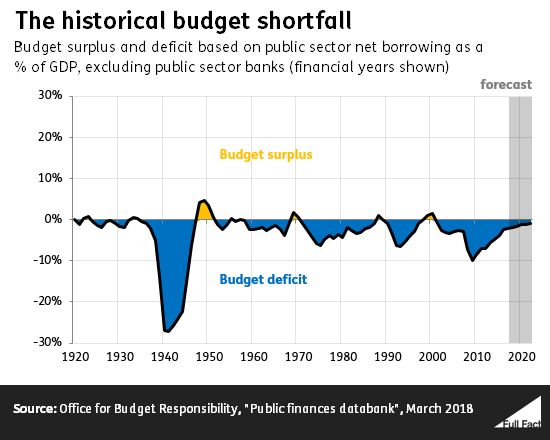
It's literally there in black and white: They had a surplus in '97? :confused:
Would this help...
MAR_18_surplus_deficit_since_1920.png

(Source)
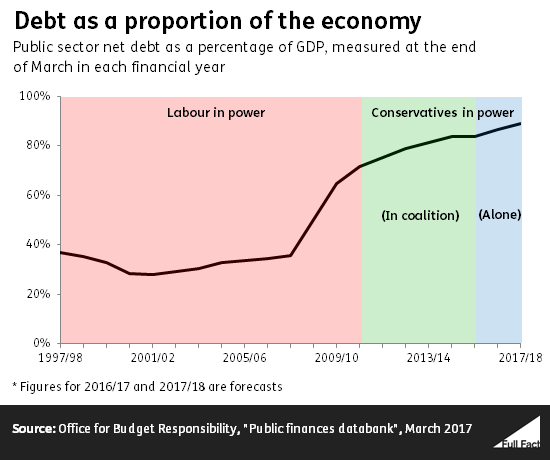
debt_as_a_proportion_of_the_economy.png

(Source)

Like it or not the myth that the Conservatives are good when it comes to public finances is exactly that, a myth. There's only been a single period that a Conservative government has had a surplus and that was a tiny one for a very short period of time.
 
No country will pay their deficit it's not happening
You don’t “pay” a deficit.

Deficit = difference between income and expenditure in one year.
Debt = the accumulation of all of those deficits over time. UK current debt is £2.3 trillion (IIRC), which is just over 100% of GDP.
 
Last edited:
Problem is (controversial) there's nothing of worth in the UK anymore....
Historically sure but now, nothing but over priced real estate and an extremely apathetic future generation.
"Why bother fighting for your country" is the vibe given off. Why indeed when you can't realistically ever afford to take part in being part of the future?
Morale has probably never been lower?
Honestly the west needs a wake up, shake up moment. It's not just the UK every country is wrecking the future to pay now.
No country will pay their deficit it's not happening, we need a better way to think about it.
The great reset..... My god it's cringe but something has to happen. WW3 maybe? Worm god? Vulcan first contact ...I'm living for the now. I don't see much future in 50 years, even on the cusp of amazing technological breakthrough with power generation and AI, we'll **** it up somehow.

Vote lib dem.

Sweden is no better incase you think I'm being a traitorous c word :p
How do you think voting for them will improve any of the problems. They will be as bound by all the factors that would be faced by either the Tories ,Labour, Greens or the Monster Raving Loony party. Economic forces at home and abroad, the attitude to their policies from the voters, how and what changes they want to make, the list goes on. Yes in it's simplest form it's let's change government but as we all know it's more complex than that
 
Would this help...
MAR_18_surplus_deficit_since_1920.png

(Source)
debt_as_a_proportion_of_the_economy.png

(Source)

Like it or not the myth that the Conservatives are good when it comes to public finances is exactly that, a myth. There's only been a single period that a Conservative government has had a surplus and that was a tiny one for a very short period of time.
That isn't a full analysis as you would have to go back right to the start of the records to show a full and complete picture, that graph has been cherry picked to show what someone wants ie Labour good Tories bad.

If you had the same time period for both charts it would show the results much better in relation to each other
 
Last edited:
If you want to go back more than 100 years to prove that it's "been cherry picked to show what someone wants ie Labour good Tories bad" my guest.

Put up or shut up as the saying goes.
 
If you want to go back more than 100 years to prove that it's "been cherry picked to show what someone wants ie Labour good Tories bad" my guest.

Put up or shut up as the saying goes.
You have posted one graph of a certain period of time showing one thing and another graph over a completely different length. To show the difference or not they should be shown over the same time, should they not?
I did not attack you so why the attitude?

You normally insist on a complex answer, those example charts do not correspond in length doesn't show a complete picture of the evidence you wanted to show
 
Last edited:
That isn't a full analysis as you would have to go back right to the start of the records to show a full and complete picture, that graph has been cherry picked to show what someone wants ie Labour good Tories bad.
If you want to go back more than 100 years to prove that it's "been cherry picked to show what someone wants ie Labour good Tories bad" my guest.

Put up or shut up as the saying goes.

There is far less difference between labour and conservatives than there is between coke and pepsi.

Bringing up charts is entirely a waste of time.

The difference is basically in what people think they are.
 
There is far less difference between labour and conservatives than there is between coke and pepsi.

Bringing up charts is entirely a waste of time.

The difference is basically in what people think they are.
I have made this point before but you can guess what happened
 
You have posted one graph of a certain period of time showing one thing and another graph over a completely different length. To show the difference or not they should be shown over the same time, should they not?
I did not attack you so why the attitude?
Who said anything about you attacking me, talk about being overly sensitive.

If you think those graphs show different things maybe you need to look harder, and if you need two charts to be over the same period of time before you can make sense of them maybe charts are to complicated for you. :cry:

Still waiting for you to prove that FullFact.org cherry-picked those stats to show "Labour good Tories bad", you got the stats that go back more than 100 years?
There is far less difference between labour and conservatives than there is between coke and pepsi.

Bringing up charts is entirely a waste of time.

The difference is basically in what people think they are.
And yet the difference is there in the stats, wishing it away isn't going to change that.
 
How do you think voting for them will improve any of the problems. They will be as bound by all the factors that would be faced by either the Tories ,Labour, Greens or the Monster Raving Loony party. Economic forces at home and abroad, the attitude to their policies from the voters, how and what changes they want to make, the list goes on. Yes in it's simplest form it's let's change government but as we all know it's more complex than that
I know it was tounge in cheek I guess I should emoji more.

I agree with you 100% it really doesn't matter who's running the UK. Global forces dictate.
 
Who said anything about you attacking me, talk about being overly sensitive.

If you think those graphs show different things maybe you need to look harder, and if you need two charts to be over the same period of time before you can make sense of them maybe charts are to complicated for you. :cry:

Still waiting for you to prove that FullFact.org cherry-picked those stats to show "Labour good Tories bad", you got the stats that go back more than 100 years?

And yet the difference is there in the stats, wishing it away isn't going to change that.
I think you can understand why I am as you say it overly sensitive but I'm not going there.
I have said you need to provide statistics over the same period of time for them to be classed as valid against each other and to pick a period which just so happens to show one particular set of facts that back up your side is no worse than the other form problem. I'm just saying to get the full picture you need to provide the data that you so love in a full formate that will show the comparison you are suggesting completely not just a snippet. I don't need to provide the information you do as you made the comment.
 
I know it was tounge in cheek I guess I should emoji more.

I agree with you 100% it really doesn't matter who's running the UK. Global forces dictate.
It wasn't meant to be, it is my opinion over 46yrs of living in this country and my education. Just because I like short and simple explanations doesn't make me unable to use common sense to work something out that is a complex problem(I get there eventually). Complexity brings about confusion
 
Last edited:
I have said you need to provide statistics over the same period of time for them to be classed as valid against each other and to pick a period which just so happens to show one particular set of facts that back up your side is no worse than the other form problem.
Read the charts, pay particular attention to what it says under the bold title, what it says each chart is a measurement of. :rolleyes:

Then maybe it will dawn on you that the two charts don't have to be over the same period because a) people know what a year is and can transpose one year to another (as in 1997 in one chart is the same 1997 in the other), and b) They're measuring different things.
I don't need to provide the information you do as you made the comment.
Well you do if you want to prove that FullFact.org cherry-picked those stats to show "Labour good Tories bad".
 
Read the charts, pay particular attention to what it says under the bold title, what it says each chart is a measurement of. :rolleyes:

Then maybe it will dawn on you that the two charts don't have to be over the same period because a) people know what a year is and can transpose one year to another (as in 1997 in one chart is the same 1997 in the other), and b) They're measuring different things.

Well you do if you want to prove that FullFact.org cherry-picked those stats to show "Labour good Tories bad".
Yes we can see that they both cover the same period that you specify all I was saying that the two graphs needed to be of the same length to show how they compared to each other. Other surpluses are shown but not in what relation to the other graph.
I didn't disagree with you on the what it showed just that it showed what you wanted to show just like me if you remember.
 
Back
Top Bottom