Soldato
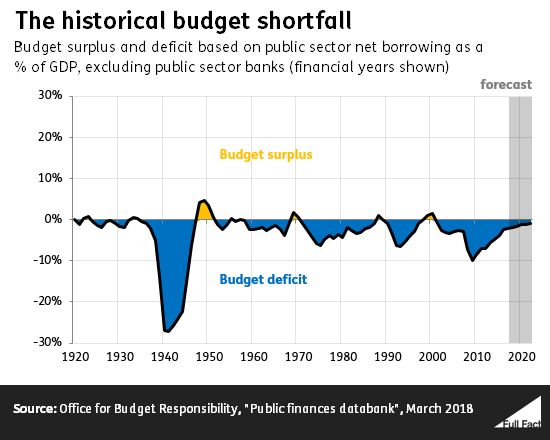
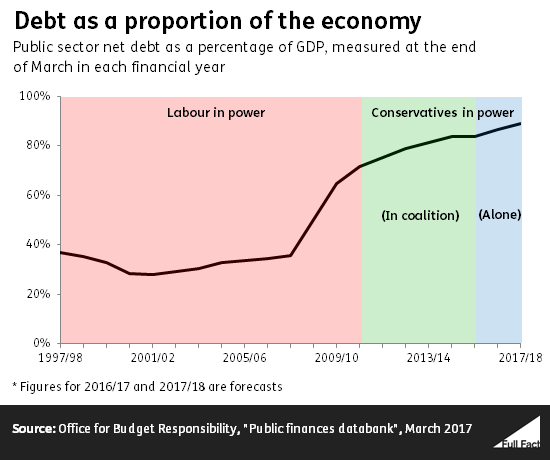
Read the charts, pay particular attention to what it says under the bold title, what it says each chart is a measurement of.
Yes we can see that they both cover the same period that you specify all I was saying that the two graphs needed to be of the same length to show how they compared to each other. Other surpluses are shown but not in what relation to the other graph.
I didn't disagree with you on the what it showed just that it showed what you wanted to show just like me if you remember.
The issue with charts and statics is that the governement at the time of period and the goverment at the time of the the report can make the reports result to whatever they want.
Government of the period... lets not record this figure... so they will be no figure for future reports..
Government of the report... naa... we should use a different benchmark or include/exclude that cost..
Normally when I get asked to write a report, I ask how do you want the outcome to reflect? I rarely get told to be unbiased.
The only thing that really matters is how you as an individual felt at that time, or how you feel about a certain party. That may be reflect more on your personal circumstances and recency bias.