Can I remind everyone that on 7 September 2021, Then PM BJ announced the introduction of a Health and Social Care Tax.
By increasing NI by 1.25% (13.25% total) rom 6 April 2022 and for a separate tax to start in April 2023 to tax people a futher 1.25%
to address the funding crisis in the sector.
This broke the tory manifesto of not raising taxes, but BJ insists that it was required.
"we cannot shirk the challenge of putting the NHS back on its feet"
manifesto:
https://www.conservatives.com/our-plan/economy
back bench anger:
https://www.theguardian.com/politic...d-tory-anger-over-manifesto-breaking-tax-rise
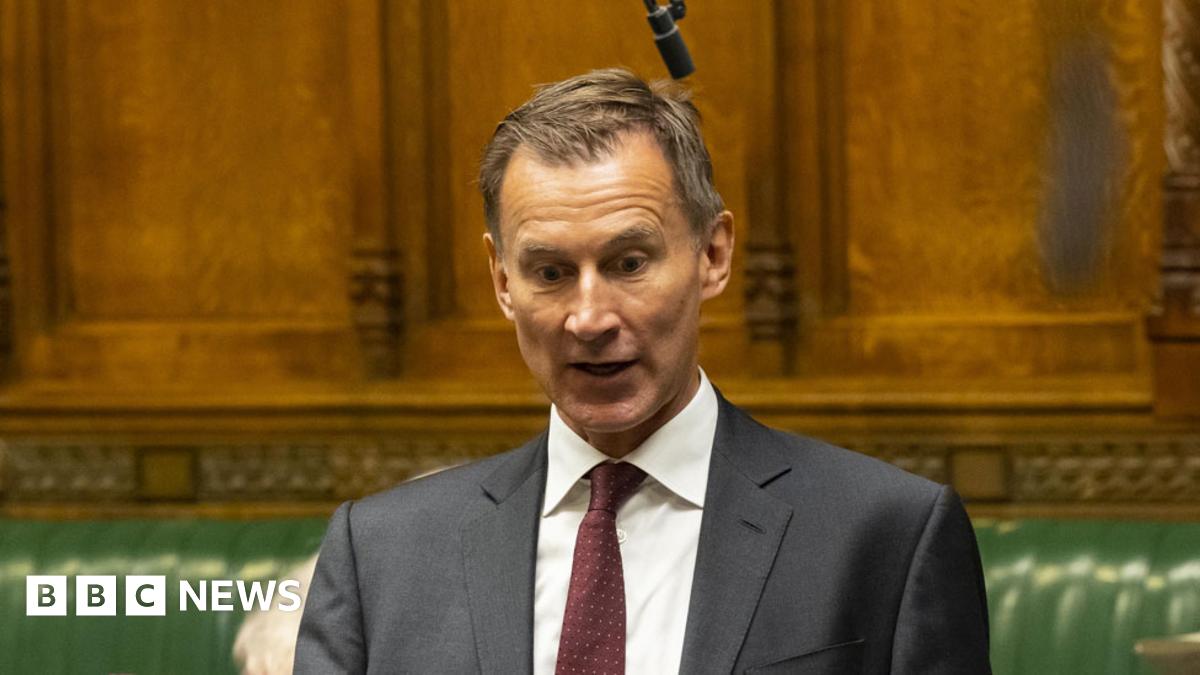
Then backbencher Hunt said
"social care does not actually get as much money as it needs."
The Conservative former health secretary tells MPs there is a risk the NHS will "gobble up" all the funds.
www.bbc.co.uk
7 months later; November 2022, This was reversed by Kami Kwarteng stating,
"Taxing our way to prosperity has never worked"
The 1.25% rise will be reversed from 6 November and a levy to fund health and social care will be axed.
www.bbc.co.uk
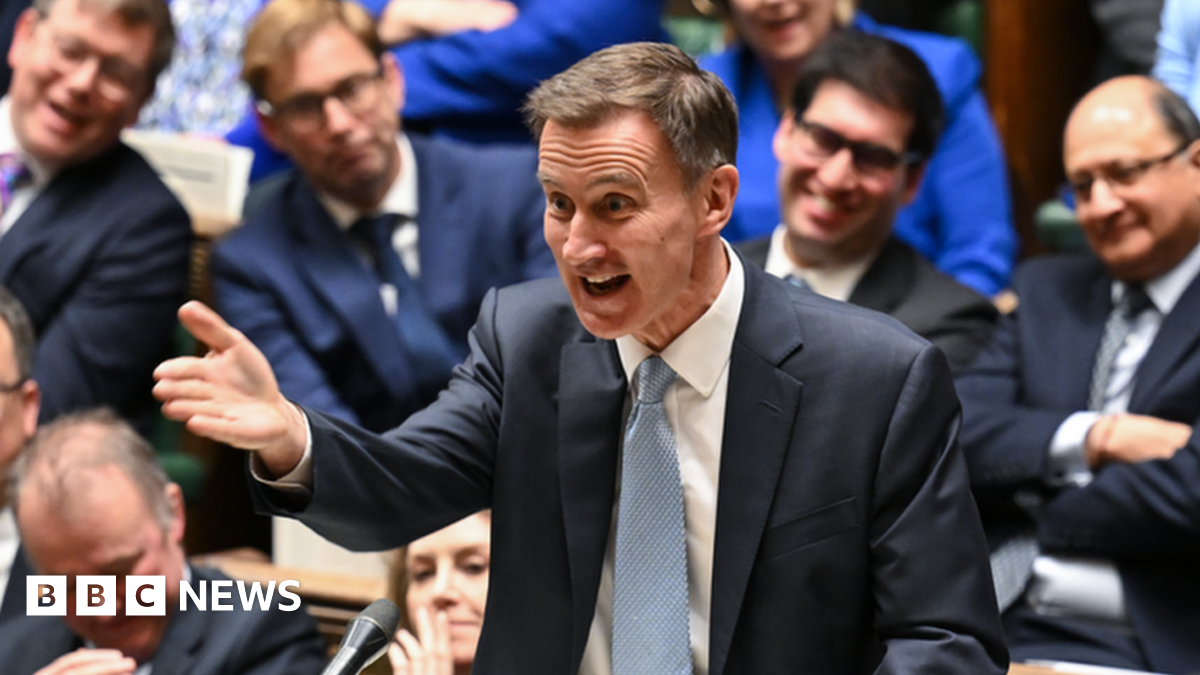
in November 2023, now Chancellor Hunt in the
"Autumn Statement for growth" announced a 2p cut to NI in January 2024.
The uk entered a recession late 2023 before the NI cuts took place.
A recession means the UK economy has shrunk for two three-month periods - or quarters - in a row.
www.bbc.co.uk
Now two days ago, during the spring budget, Chancellor Hunt cuts NI by 2% again...
But Labour says many people will still be worse off because of existing freezes to income tax bands.
www.bbc.co.uk
So in the space of less than 2 and a half years... the same party that was predicting gloom and doom for the future of our health service unless we start to pay an extra 3%+ now thinks that we can pay 4% less and it will be fine.
Please tick all that applies...
[ ] they have found a magic money tree
[ ] they make **** up as they go along
[ ] they don't care about the billions of people that need the NHS nor the future of social care
[ ] it's an election year
[ ] they are salting the battlefield before losing the war.
[ ] other, please explain: