

Just 6.2 with 4.1 exported, Kent's turn for the bad weather.
You are using an out of date browser. It may not display this or other websites correctly.
You should upgrade or use an alternative browser.
You should upgrade or use an alternative browser.
Solar panel production figures
- Thread starter Ron-ski
- Start date
-
- Tags
- generation solar
More options
View all postsDepending on what system you have you may be able to get retrofitted.Really should have asked whether our solar batteries would keep us powered
27.2 generated and 12.2 exported.
28 generated and 26 exported.
Last edited:
It'll do more than that, probably 60+, best I had last year was 57 IIRC.I think my system should do 50+ on a perfect day in the summer.
Last edited:
First time I've passed 30 this year, with 30.6 generated and 28 exported.
22 generated, and 21 exported.
27.1 generated and 23.8 kWh exported
Last edited:
22.8 generated and 20.4 exported.
23.3 generated, and 20.7 exported.
20 generated and 15.8 exported.
That's because we drove home today, spent the last week in Newton Ferrers, just outside Plymouth, with the weather the way it was I thought I was in Wales.
but a very nice warm spring day down hear
That's because we drove home today, spent the last week in Newton Ferrers, just outside Plymouth, with the weather the way it was I thought I was in Wales.
@Oldman2 if you read the page you linked to it can use your Octopus API key, and also appears to imply it stores parameters in the URL, so perhaps you need to bookmark that URL once it's all setup. It may also use cookies, so make sure they are enabled.
Generated 19.8 kWh today, with 10.14 exported.
Today's generation was just enough to push us to 600.86 kWh for the month (2023 was 531 kWh), just over double February's generation.
Looking at my SolarEdge system the best March was 2020 with 430.7 kWh, whereas this March was 309.5 kWh, worst March was 2018 with just 251.1 kWh generated.
Total year to date: 1120 kWh
Last edited:
We had a peak of 8912.8 watts at 13:39, I think that's the highest peak I've ever noticed.
You will have peaks close to or above you're installed capacity, the graphs simply don't catch the data often enough to see it. PV Output shows you had a peak of 7.2 kW at 14:45, I fully expect you've had a much higher peak.
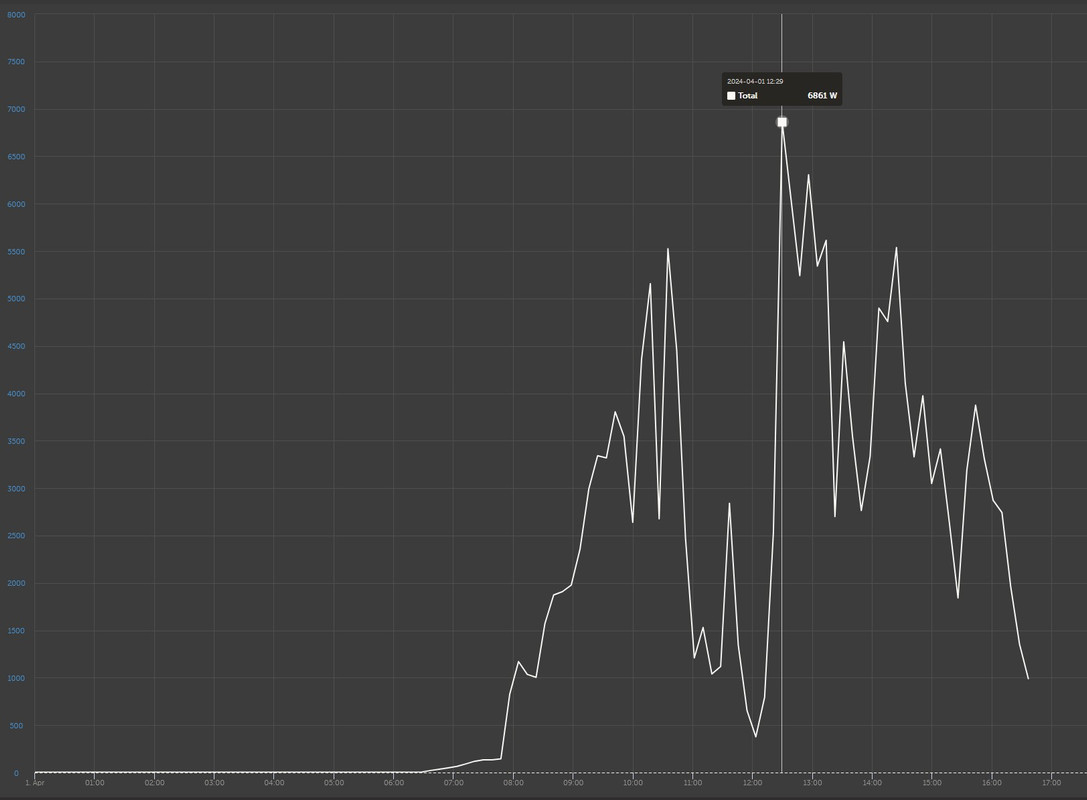
Here's my daily graph,at first glance the highest peak looks to be 6861 Watts at 12:29, and then its all down hill.
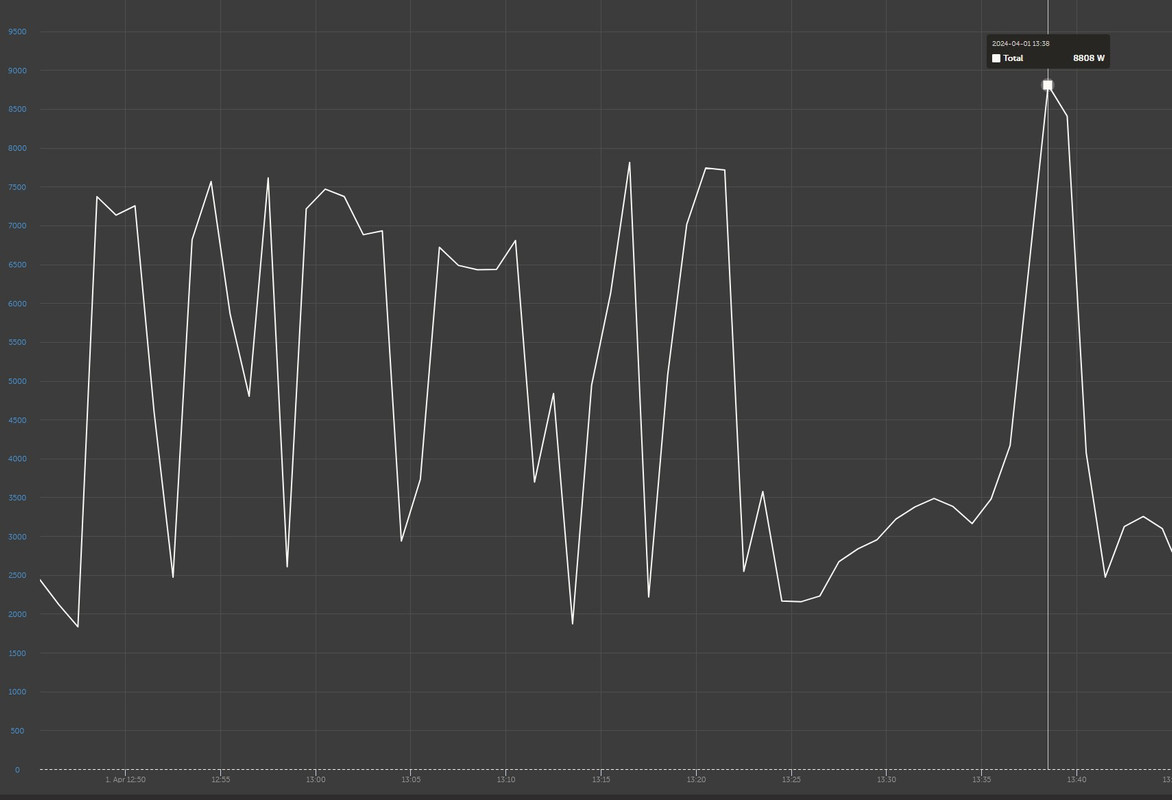
If I zoom in though I can see that 13:38 actually has a higher peak of 8808 watts
Now look at the gauges running on Node Red, and I can see the days highest peak was 8912.8 Watts at 13:39 (it doesn't show the seconds).
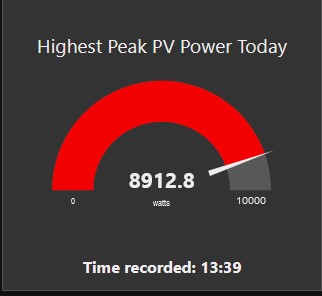
The main graph shows the values roughly every 8 minutes, zoom in close enough and its every minute, but my code running on Node Red is comparing the values every 5 seconds, so its far more likely to capture that peak power moment. It will likely be the same for any other installation, the graphing will just misses the biggest peaks unless they occur at the exact moment the data is stored.
Here's my daily graph,at first glance the highest peak looks to be 6861 Watts at 12:29, and then its all down hill.
If I zoom in though I can see that 13:38 actually has a higher peak of 8808 watts
Now look at the gauges running on Node Red, and I can see the days highest peak was 8912.8 Watts at 13:39 (it doesn't show the seconds).
The main graph shows the values roughly every 8 minutes, zoom in close enough and its every minute, but my code running on Node Red is comparing the values every 5 seconds, so its far more likely to capture that peak power moment. It will likely be the same for any other installation, the graphing will just misses the biggest peaks unless they occur at the exact moment the data is stored.
Last edited:
29.7 generated and 27.7 exported.
19.6 generated, 17.761 exported.
26.3 generated and 26.4 exported.
28.5 generated and 28 exported.
Starting to get some good days on Flux, -£1.15 yesterday, and -£1.72 on Monday, Wednesday was £0.34 and for some reason no data for Tuesday,even they it shows in Octopus.
I force export at 4.5kW from the battery (solar may add more) from 4pm until 45% SOC, which is usually just before 7pm - hit that at 18:57 today.
We spent the day in London as our daughter run a half marathon (1:56), it was sunny and very windy.
Back home it must have been sunny, 35.14 generated and 37.4 exported, which I think is a record on both counts for this year.
Back home it must have been sunny, 35.14 generated and 37.4 exported, which I think is a record on both counts for this year.