That chart just makes you feel sick
It's also very misleading as it completedly ignores the rise of petrol to 120+p a litre and diesel to more than 134p a litre in Summer 2008.
That chart just makes you feel sick
[TW]Fox;23851226 said:It's also very misleading as it completedly ignores the rise of petrol to 120+p a litre and diesel to more than 134p a litre in Summer 2008.
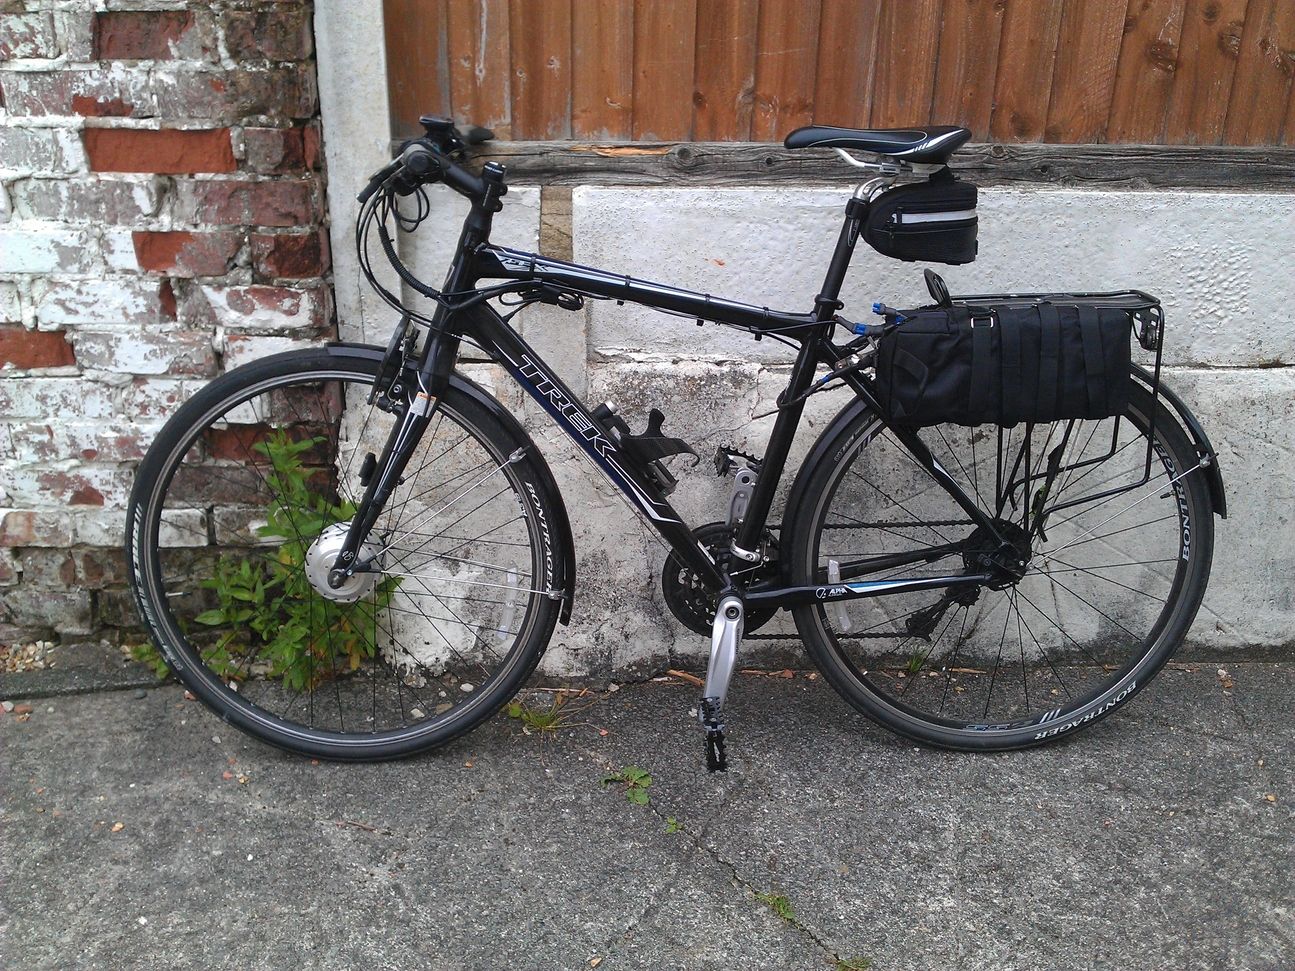
Details of the electric bike please. Interested.


[TW]Fox;23851226 said:It's also very misleading as it completedly ignores the rise of petrol to 120+p a litre and diesel to more than 134p a litre in Summer 2008.
You also need to use RPI ignoring fuel price changes otherwise it tells you very little. You can't completely do that as even food and goods have a fuel element in them, but you can remove the pure fuel bit.

Don't forget the changing of British Standards over the years for energy content...
You mean the introduction of ethanol
How much is LPG per liter ??
Most the garages where I live no sell it..
Took a wee trip to try and find some Good year Eagle F1 assymetric's ins tock (and that's another story) but the fuel in our town is the most expensive for miles around. 1.40.9 at the Shell and Morrisons. Even the local independant 'Murco' was 2p cheaper!
[TW]Fox;23853992 said:This is whats amusing about using 'real terms' pricing to show something 'hasn't really increased' when the item being discussed is a fairly significant part of the metric used to calculate RPI in the first place!
'In real terms fuel hasnt increased, when we use a calculation driven by how much fuel has increased'
Rail tickets are another good one. 'Oh they are only going up by inflation, so really, if they didnt go up, in real terms they'd have gone down'!. Yes, but the tickets themselves are considered in the RPI calculation, so its a self fulfilling prophecy..

