• Competitor rules

    Please remember that any mention of competitors, hinting at competitors or offering to provide details of competitors will result in an account suspension. The full rules can be found under the 'Terms and Rules' link in the bottom right corner of your screen. Just don't mention competitors in any way, shape or form and you'll be OK.

*** AMD "Zen" thread (inc AM4/APU discussion) ***

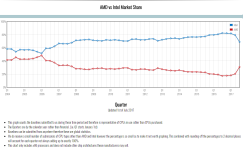
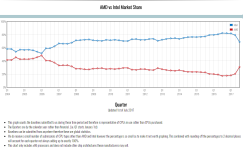
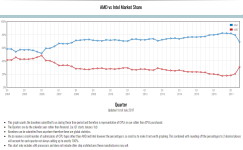
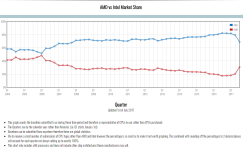
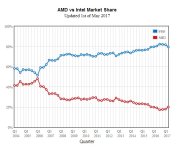
The last datapoint is Q3 though.

Did you look at the graph data points? It shows Q1 2017 and Q2 2017 ending at Q3 for current lol.

Showing Q2 was when AMD went up UNTIL today.

AQ9Ow9jQSbi5jCasHtKZeg.png
 
I did. How about you do that and read the notes below.

Q1 starts on Jan 1st etc.

So Q3 datapoint only started today.

Exactly. Not hard to grasp. It ENDS at Q3 because that's today. It clearly shows the markshare gain from Q1 - end of Q2...which is*gasp* today, the point start of Q3

Where else would they put Q2 data? At the Start of Q2?
 
Exactly. Not hard to grasp. It ENDS at Q3 because that's today. It clearly shows the markshare gain from Q1 - end of Q2...which is*gasp* today, the point start of Q3

Where else would they put Q2 data? At the Start of Q2?

Why have they put Q2 data point above the Q2 point in the graph?

Have you done a graph before? That is what most software does. It does not interpolate between x-axis points.
 
Why have they put Q2 data point above the Q2 point in the graph?

Have you done a graph before? That is what most software does. It does not interpolate between x-axis points.

It's On the Q2 line.... what's so confusing.

e9fK-qPLRP_jD3Wl9a0Z1w.png


It looks to me like the period from start the end of Q1 2017, thats what it says on the graph.

When did Ryzen go on sale, exactly?

Ryzen went on sale 1.5 weeks before Q1 ended.
 
We'll see. If that graph is updated tomorrow, then either a Q3 to Q4 line will be introduced or I am right and they are simply categorical x axis labels.
 
Ah i see, so there was a small but noticeable gain for Ryzen in Q1 given 10 days worth of sales, but a huge gain in Q2 which accounts for a full quarter.

Yeah, I don't understand the confusion. It shows the marketshare gained Upto Q3, which is when Q2 ends. It clearly says it was updated 1st of July 2017; which is the end of Q2, and start of Q3.
So of course shows the marketshare gained/lost up to the end of Q2.

Edit, the data for Q1 also ended on Q2 start date, just like it does now for Q2 ending on Q3 start date.
https://www.eteknix.com/amd-gains-2-2-cpu-market-share-intel-q1-2017/
twlbH2N.jpg
 
Last edited:
If you want to understand the confusion, according to you logic, the last point here (switch to viewing it by year)

https://www.ons.gov.uk/economy/inflationandpriceindices/timeseries/l55o/mm23

refers to inflation from 01/01/2015 to 01/01/2016. After all the line ends on 2016.

I can tell you it actually refers to 01/01/2016 to 01/01/2017. This is how 99% of graphs are drawn.

Yeah, I still don't see the confusion regarding the passmark one at all.

It clearly shows Q2 data from May 1 up to Q3 July 1st.

AMD went into Q1 with 18.10%, Q2 with 20.60%, and went into Q3 with 31.00%.

Q3 final data will be updated when Q4 starts.
 
Back
Top Bottom