

How many will that be? You must be getting close to the inverter maximum.just about to put my order on for another 9 panels, then I'm done.....................
You are using an out of date browser. It may not display this or other websites correctly.
You should upgrade or use an alternative browser.
You should upgrade or use an alternative browser.
Solar panel production figures
- Thread starter Ron-ski
- Start date
More options
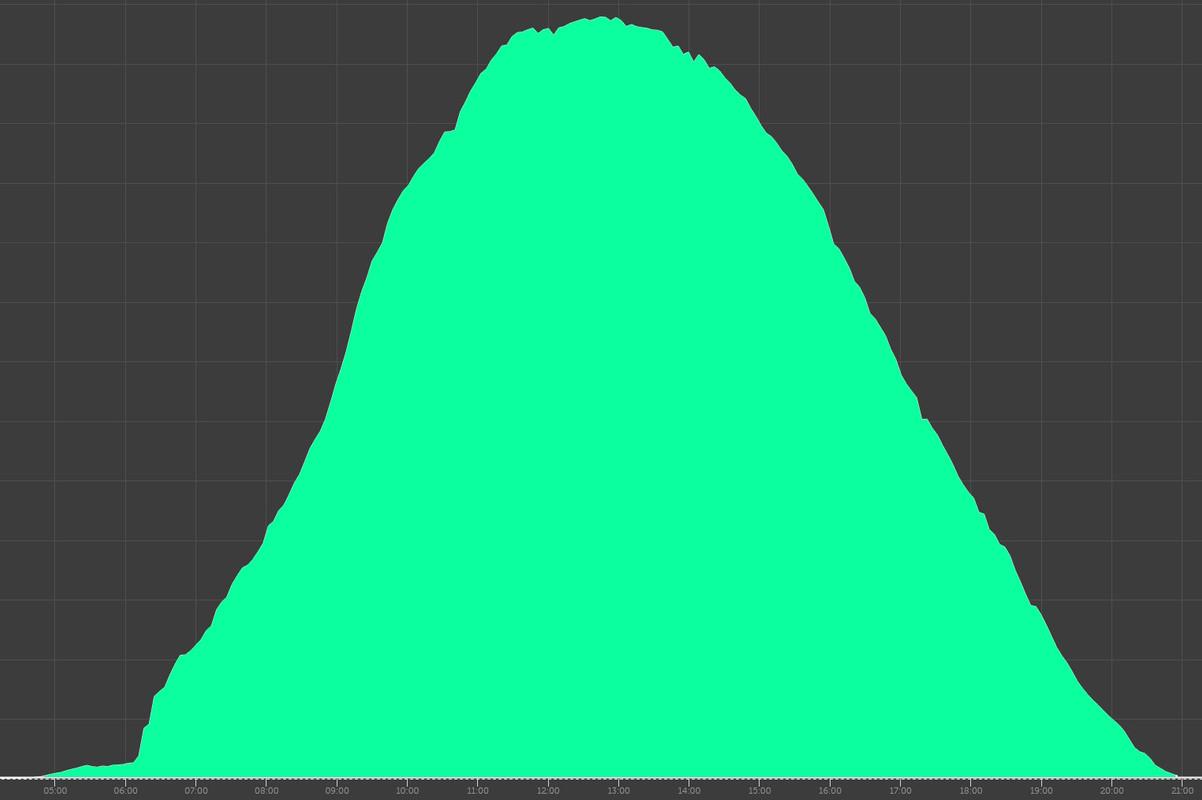
View all postsThe solar forecast did have a big drop off late afternoon, and the small clouds had been around for a while, some dark clouds forming now - it is forecast to rain tomorrow, and next week is not looking as good anymore.I'm laughing. What an amazing jinx, a perfect day upto 15:50...when I posted. The next two uploads of data, massive dip in generation.
Last edited:
Last June 1291 kWh, this year so far 880, up to yesterday we were averaging 38.9, which would be 1167, so we are well down unless the clouds do one as well.
In fact we'd need 58.7 each day to catch up with last year, I think we can all agree that's not going to happen.
In fact we'd need 58.7 each day to catch up with last year, I think we can all agree that's not going to happen.
Can I check with you guys my figures? There's so much info I can't really see the wood for the trees.
This report is just for Saturday (yesterday) which was a touch cloudy but nice most of the day. My panels are 3 south facing, 13 west facing. I have a 8.2kw givenergy battery. I have set the battery to harge from grid from 3am and discharge in the early evening. I've copied the following data from the Givenergy report.
Energy flow:
Solar - 25.93kwh
To home: 6.18kwh
To battery: 0.03kwh
To grid: 19.72kwh
Battery - 2.42kwh
To home: 2.37kwh
To grid 0.05kwh
Grid - 6.17kwh
To home: 1.42kwh
To battery: 4.75kwh
Are there any numbers I need to provide to give a complete picture? How does it look? Would love to know how effective it is.
That looks to me like your panels generated 25.93 kWh, and the rest under energy flows says where that energy went.
The next section seems to imply the battery discharged 2.42 kWh, 2.37 to the home and 0.05 to the grid, and the last section shows what you used from the grid and where it went.

Please post in this threadAdvice needed please
Solar panels and battery - any real world reccomendations?
Saw a thing yesterday with Anker moving into the space. Looked pretty nice actually.
 forums.overclockers.co.uk
A rather poor day today, with just 22.97 kWh generated and 18.485 exported.
That makes the total for June 1227 kWh generated, 1047 exported and 528 kWh imported.
Beat Mays 1047, but last June was 1305, which was actually slightly worse than last May, which was 1325.
That makes the total for June 1227 kWh generated, 1047 exported and 528 kWh imported.
Beat Mays 1047, but last June was 1305, which was actually slightly worse than last May, which was 1325.