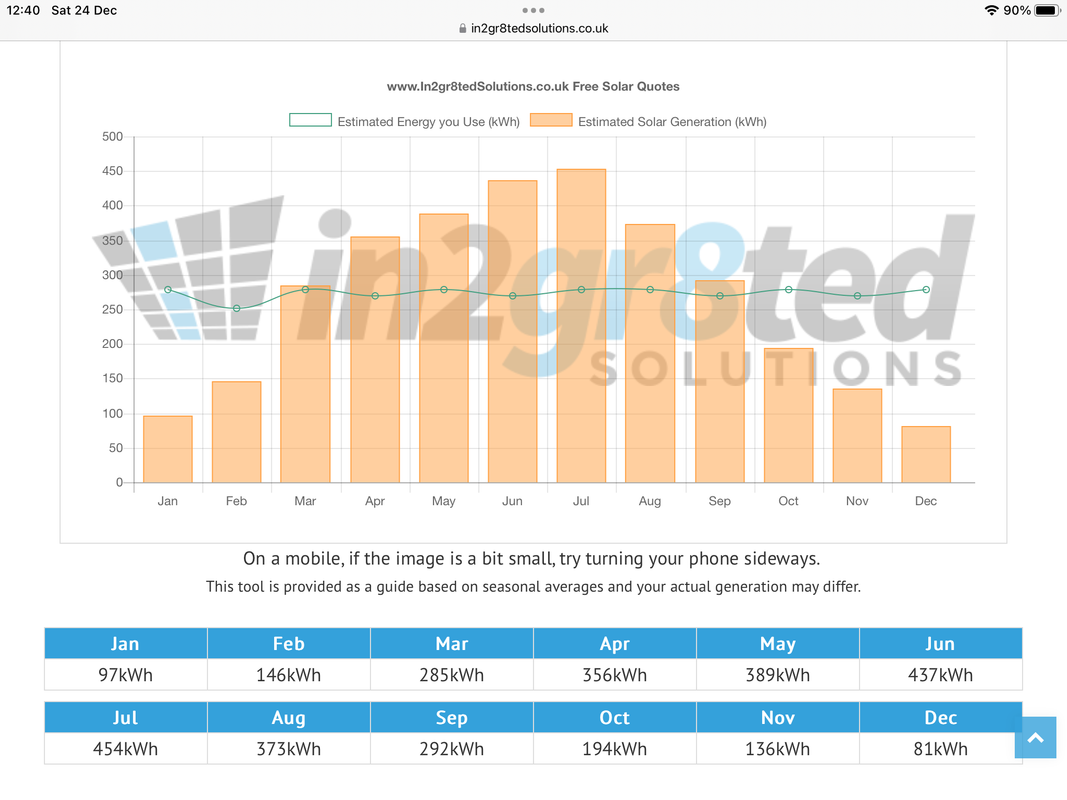
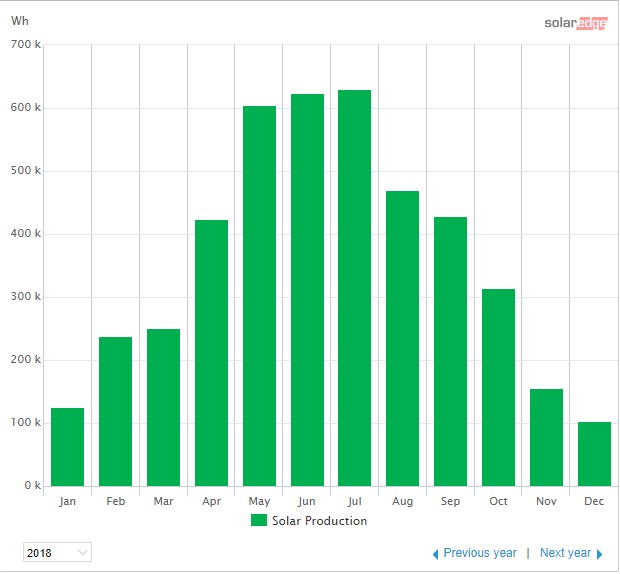
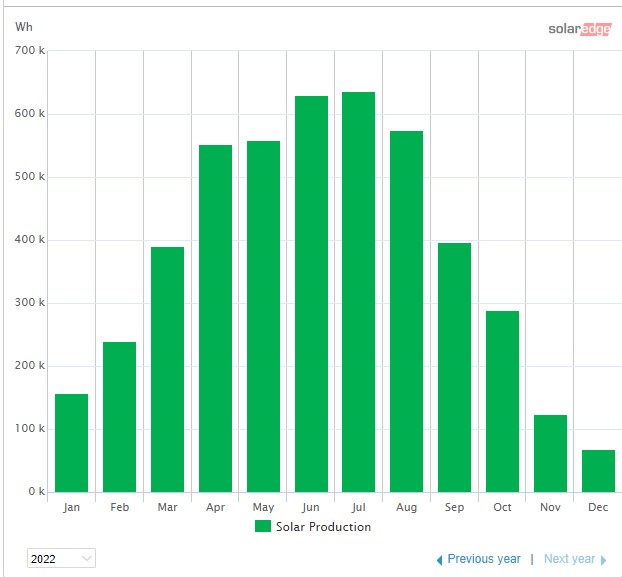
The solar saddo that I am, I have crunched the figures above against my predicted monthly targets. I am assuming the same overall output for the year.
Jan 113
Feb 159
Mar 307
Apl 391
May 398
Jun 415
Jul 365
Aug 341
Sep 288
Oct 238
Nov 127
Dec 97
Total 3240
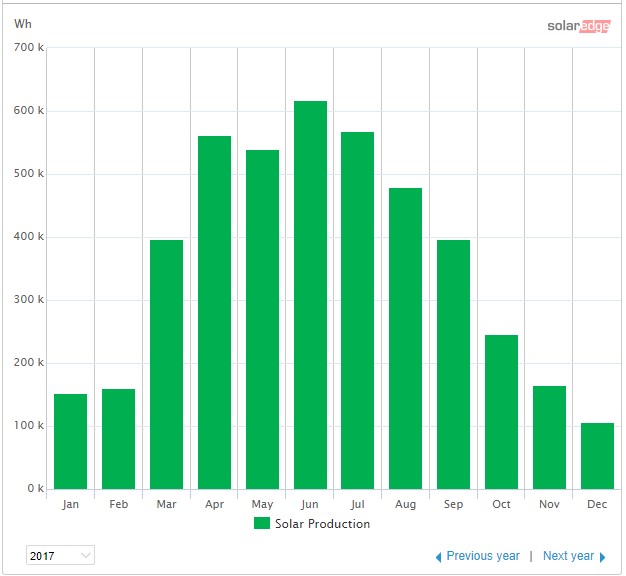
What sticks out is the higher predictions for July and August. I think this is the result of using theoretical predictions against actual data. In real life, my panels like myself, have lower energy levels when it is hot (July) or even hotter (August). The one thing I do remember, when I collected my data from Germany in 2011, is that solar output is significantly higher in the 3 months prior to the summer solstice than the 3 months following. If this is because of the higher ambient temperatures it would explain quite a lot.
Good luck with getting 97kw this month.
Domestic is out of bed so I need to be good.....................